EMC manual System description Building Technologies s
Siemens Switzerland Ltd Industry Sector Building Technologies Division Gubelstrasse 22 6301 Zug Schweiz Tel. +41 41-724 24 24 www.siemens.com/sbt © 2009 Siemens Switzerland Ltd Subject to change 2 / 36 Siemens Building Technologies EMC manual – System description CM110911en_03 18.09.
Contents 1 About this document ..............................................................................5 1.1 Copyright...................................................................................................5 1.2 Quality assurance .....................................................................................5 1.3 Document use / request to the reader ......................................................5 2 Energy management via the Internet....................................
/ 36 Siemens Building Technologies EMC manual – System description Contents CM110911en_03 18.09.
1 About this document 1.1 Copyright This document may be duplicated and distributed only with the express permission of Siemens, and may be passed only to authorized persons or companies with the required technical knowledge. 1.2 Quality assurance These documents were prepared with great care. • The contents of all documents are checked at regular intervals. • Any corrections necessary are included in subsequent versions.
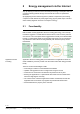
2 Energy management via the Internet Only by keeping a continuous record and analysis of energy consumption data is it possible to identify potential savings and evaluate the success of optimization measures. By highlighting external influencing factors (weather compensation) and making comparisons with defined set points (target energy figures), EMC helps customers make reliable judgments about the consumption of energy. 2.1 Functionality EMC is based on ASP (Application Service Providing) technology.
2.
2.3 Scope Energy monitoring and control systems are required to fulfill a wide range of requirements, extending from the simple logging of consumption data to complex analysis of a variety of consumption control features. Energy management systems are required to satisfy widely varying requirements. This is why EMC is modular in structure. This means that different functions and reports can be made available, depending on the required area of emphasis.
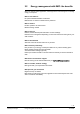
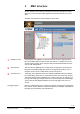
3 EMC structure Intuitive operation and continuity of design ensure the user-friendliness of EMC. Even users unaccustomed to Web applications will quickly find their way round EMC. The EMC user interface is clearly divided into three areas. 1 2 3 1 Navigation menu The navigation menu (pane 1) on the left side of the screen is displayed all the time and provides direct access to all the main features.
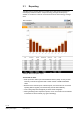
3.1 Reporting The EMC energy reporting feature is notable for its clear structure and easy-toread display of relevant values. It helps the energy manager decide quickly whether or not there is a need for corrective action in the field of energy management. Example: Main consumption report The benefits in detail • Most reports are made up of several different sheets (views). An easy-to-read summary of results is supported with a useful number of additional detailed views.
3.1.1 Generating reports Reports can be generated for all nodes in the hierarchical structure (customer, building pool, site, object and element). Meter data is automatically summarized and grouped by medium and meter type. Reports normally include tables and graphs. Creating a report A report is generated either for a node (as in the following example) or directly for a particular meter. Different reports are provided, depending on which of these options is selected.
CSV format (ASCII) for further editing. Report favorites allow quick access to important reports, especially when dealing with large, complex structures. 3.1.2 Exporting reports All reports can be saved on a local hard disk as CSV (comma-separated values) files, to allow further processing of the consumption data (e.g. with Microsoft Excel). Diagrams and graphs can be inserted into other applications via the clipboard. 3.1.
3.2 Meters and media 3.2.1 Meters EMC operates with four different types of meter: • Main meters The main meters register energy consumption in a central location (e.g. the district heating transfer meter belonging to the utilities company) • Sub-meters These measure a part of the energy flow recorded by the main meter (e.g. the heat meter for one floor of a building) • Invoice meters It is possible to enter the consumption as reported in the utilities company bill.
Virtual meters In addition to physical meters, EMC also supports virtual (i.e. calculated) meters. Meter replacement For meters that need to be replaced on site, EMC includes a meter replacement function, which allows you to document the process, at the same time ensuring the continuity of the data. 3.2.
3.2.3 Individual meter readings Manually entering meter and consumption data Meter or consumption data is handled in a central database. The person responsible enters the data on site via the Web browser (decentralized data entry). If the meter is not read regularly, the data is balanced out with daily interpolated values. Individual meter readings can be entered by selecting a meter from the tree structure. All previous meter readings can be displayed with the Display All Readings option.
Printed version of meter list A special print view is available for noting down the meter readings when going physically from one meter to another or from building to building. Plausibility check As meter readings are recorded, they are checked for plausibility. If a given reading is lower than the previous reading, a warning message is issued.
3.2.4 Automatic reminders The automatic reminder feature helps ensure that meters are read at regular intervals. First reminder The first reminder is sent by the planned reading date. Reminders can be sent at the following intervals: • Weekly • Monthly • Every two months • Quarterly Second reminder If no readings are entered, a second reminder is sent after the planned reading date.
3.3 User structure/other functions The user structure allows intuitive and effective structuring of the meters based on the functions used and the reports required. User structure Any number of structural nodes can be set up at the different hierarchical levels ("Building pool", "Site", "Object", and "Element"). Meters can be allocated to each of these nodes. Energy reference areas An individual energy reference area can be assigned to each site and object.
3.4 Media properties Emission factors The CO2 emissions associated with energy consumption can be displayed for all CO2-emitting media. Consumption values can be converted into the required units [kg CO2] by use of emission factors. Newly defined or modified emission factors are assigned a time stamp which is automatically taken into account in the reporting function. Calorific values For heating media measured in volumetric units, individual calorific values can be assigned to each node.
3.5 User management and access rights Different access rights can be assigned to different users, depending on their role and level of expertise. This makes it possible to specify which staff can view which structure nodes and meters, and who can modify or, if appropriate, delete values. 3.5.1 SuperUser User roles The SuperUser has access to all the functions of the EMC application. Only one person in the customer's organization can be assigned this role.
a partner. This ensures that the administration of even large-scale projects with numerous sites and users is manageable for the SuperUser. Partners cannot set up additional partners. EMC safety feature Meters deleted by a user or partner are automatically moved to the "Recycle Bin" of the SuperUser account. It is then up to the SuperUser to confirm the deletion of the meter or reinstate it. 3.5.2 Access rights Read access One person within the structure is responsible for each node.
3.5.3 Remote access EMC supports efficient and secure access to building automation and control systems using e.g. DESIGO Web on the customer network. EMC additionally allows for remote energy management in building automation and control system. This function is based on a harmonized Siemens remote service platform (common Remote Service Platform – cRSP), used in numerous other Siemens areas.
3.6 Energy certificates Overview Many countries demand energy certificates for buildings in accordance with statutory provisions. Energy certificates are established based on various calculations and guidelines. Storage Energy certificates can be stored in EMC on any node within the overall structure. A validity period can be added as an additional feature to each certificate. Nodes containing an energy certificate provide certificate information in a clear and transparent node details display. 3.
3.8 Security The application and database servers required for EMC are located in a Siemens data center. The server farm runs in a "demilitarized zone" (DMZ) with professional firewalls which protect the application both from the Internet and from the Siemens intranet. The application and the data are located on separate servers. There is no access to the database server via the Internet. The database server can be accessed only via the EMC application, located on the application server.
4 Optional modules Energy management systems are expected to fulfill an extremely varied range of requirements. This is why EMC is modular in structure. This means that different functions and reports can be provided, depending on the required area of emphasis. Customers can add as many optional modules to the standard package as they need to deal with their particular energy-related concerns. 4.
Additional reports Dedicated reports for weather adjustments facilitate the detailed analysis of consumption values: • • • • • • • Main consumption (HDD) Main consumption, node comparison (HDD) Main consumption, year-on-year comparison (HDD) Main consumption, year-on-year comparison, cumulative (HDD) Main consumption cooling Climate data Heat/HDD Example: Main consumption, year-on-year comparison (HDD-adjusted) 26 / 36 Siemens Building Technologies EMC manual – System description Optional modules CM11
4.2 Automated meter reading (AUT) Function The automated meter reading feature delivers values every 24 hours or every 15 minutes (load profiles) for a detailed analysis of energy consumption. Topology EMC can handle data (consumption values, measured values, …) from different systems. The integration options are as follows: • Building automation and control systems (APOGEE Insight, DESIGO Insight, SICLIMAT, ...
Data quality Automatic data can be monitored for data integrity as well as deviations. The following properties can be monitored: • Missing values • Negative values • "0" values Warning and alarm limits are provided for deviations of values (deviation in percent from a historic mean). Notification occurs via email or SMS (as desired). 4.3 Controlling (CON) Function The Controlling package helps users to see where the energy consumption deviates from the budget values.
Example: Main consumption, budget 29 / 36 Siemens Building Technologies EMC manual – System description Optional modules CM110911en_03 18.09.
4.4 Function Costs (COS) Here, the costs resulting from the consumption of energy are displayed, with an option for comparing energy costs per building As with all other media properties, prices, too, can be entered for each node in the structure. Currently, EMC provides standard support for a mixed-price model with an annual proportion of fixed costs (fixed costs + factor * consumption). Other price models can be enabled by arrangement with your local Siemens office.
Example: Main consumption costs 31 / 36 Siemens Building Technologies EMC manual – System description Optional modules CM110911en_03 18.09.
4.5 Function Benchmarking (BEN) This option allows the display and comparison of additional consumption-based performance indicators such as kWh/person. This makes it possible to produce meaningful reports which provide an overview of the energy consumption values as a function of another, additional value. EMC differentiates here between specific performance indicators (e.g. kWh/person) and characteristic values for area (e.g. kW/m2).
Example: Main consumption performance indicators 33 / 36 Siemens Building Technologies EMC manual – System description Optional modules CM110911en_03 18.09.
4.6 Function Environment (ENV) The analysis of emission levels is growing in importance. The environment package from EMC can be used for a detailed analysis of emissions. Mathematical models for analyzing additional emissions (CO, CO2, CxHy, NOx, SO2, dust) are available.
4.7 Load profile Function Analysis of load profile data is a decisive component of a comprehensive energy management process. Load profiles can be evaluated for individual days, weeks, months and years. A load duration curve is also available to determine power demand for an object.
Siemens Switzerland Ltd Industry Sector Building Technologies Division Gubelstrasse 22 6301 Zug Schweiz Tel. +41 41-724 24 24 www.siemens.com/sbt © 2009 Siemens Switzerland Ltd Subject to change 36 / 36 Siemens Building Technologies EMC manual – System description CM110911en_03 18.09.