
Operating Instructions

Function diagrams
Free function blocks
2-612
© Siemens AG 2008 - 2013 All Rights Reserved
SINAMICS G120 CU230P-2 Control Units List Manual (LH9), 01/2013
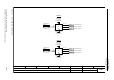
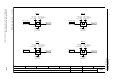
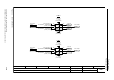
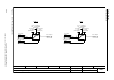
Fig. 2-104 7226 – PLI (polyline scaling)
- 7226 -
Function diagram
87654321
fp_7226_97_59.vsd
Arithmetic function blocks
G120 CU230P-2
12.12.2012 V4.6
PLI (scaling polyline)
PLI 0
PLI 1
r20379
PLI 1 output Y
PLI 1 RTG
5 ... 9999
p20382 (9999)
PLI 1 RunSeq
0 ... 32000
p20383 (990)
PLI 1 X-coordinate
-340.28235E36 ... 340.28235E36
p20380 (0.0000)
PLI 1 Y-coordinate
-340.28235E36 ... 340.28235E36
p20381 (0.0000)
PLI 1 input X
(0)
p20378
Yn
Xn
A18/B18
A19/B19
A1/B1
A0/B0
X
Y
r20373
PLI 0 output Y
PLI 0 RTG
5 ... 9999
p20376 (9999)
PLI 0 RunSeq
0 ... 32000
p20377 (980)
PLI 0 X-coordinate
-340.28235E36 ... 340.28235E36
p20374 (0.0000)
PLI 0 Y-coordinate
-340.28235E36 ... 340.28235E36
p20375 (0.0000)
PLI 0 input X
(0)
p20372
Yn
Xn
A18/B18
A19/B19
A1/B1
A0/B0
X
Y
XY
XY
Breakpoint 0 (A0/B0 = p20374[0]/p20375[0]) ... Breakpoint 19 (A19/B19 = p20374[19]/p20375[19])
Breakpoint 0 (A0/B0 = p20380[0]/p20381[0]) ... Breakpoint 19 (A19/B19 = p20380[19]/p20381[19])
Note:
This function block randomly adapts output variable Y to input variable X by means of up to 20 breakpoints in 4
quadrants.
Interpolation is carried out linearly between the breakpoints. Outlying the area A0 to A19, the characteristic curve runs horizontally.
During configuration, you must ensure that the values of A0 to A19 are arranged in ascending order. Otherwise the
values at the output will not be correct. The values B0 to B19 can be selected at random, i.e., independently of the
previous value.
If breakpoints are not needed (e.g., A16/B16 and higher), the following values of the X- and Y-coordinates (A16/B16 to
A19/B19) must be assigned the same values as A15/B15.