
User Manual
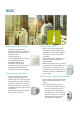

• Electrical energies and outputs, heat
volumes and gas, water and oil
consumption can all be recorded,
compared and evaluated
• A trend display for recording and
displaying up to 10 data points over a
range of different graphs or bar charts
• Room conditions, such as temperature,
room humidity and CO
2
content are
monitored
• Weather data, such as outdoor
temperature, outdoor brightness or
wind speed, can be visualized
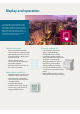
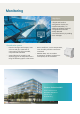
Monitoring
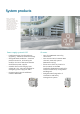
Visualization system
Highlights
• Simple and intuitive
configuration via the pre-
installed web editor; no
additional software required
• Irregularities and errors
swiftly detected
• Unrivalled security by sending
error messages
Siemens Switzerland AG
Smart Infrastructure
BUILDING PRODUCTS
Theilerstr 1a
CH-6300 Zug
Source: Burkhardt+Partner Zürich