
User Manual
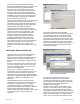
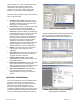
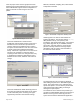
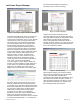
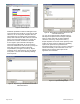
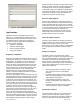

Table Of Contents
Siemens Industry, Inc.
Page 5 of 10
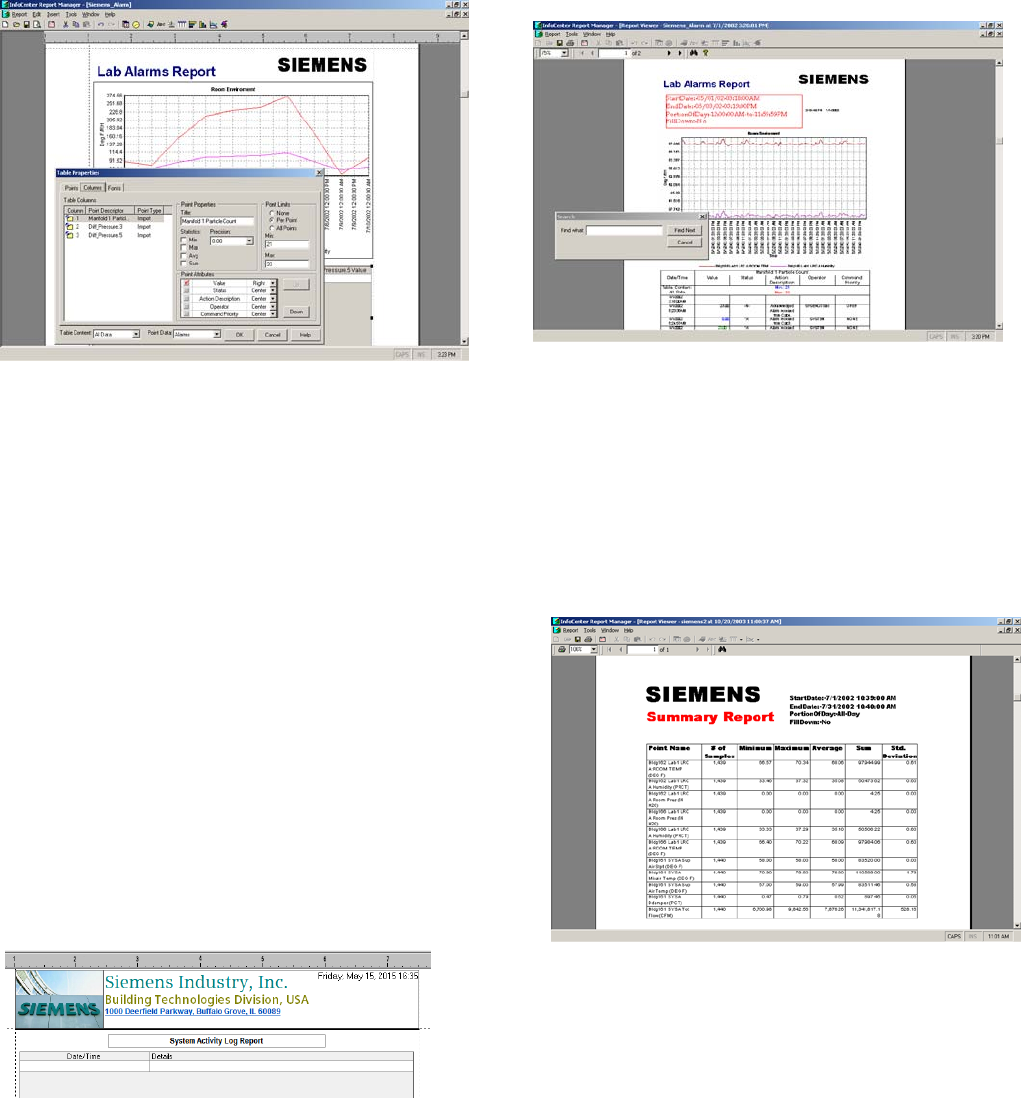
InfoCenter Report Manager
Figure 9. Create Report Templates with Report Manager.
InfoCenter Report Manager serves as the interface
for queries to InfoCenter Server and generates
reports based on templates that you create. Reports
can include any of the record types stored in the
InfoCenter Server. InfoCenter Report Manager's
user-friendly toolbars and menus simplify query-
based reporting and allow for fast and simple
creation of report templates without the need for
extensive macro language coding. The templates
define the formatting of the report and the points
used to collect data for a report. Formatting options
include charts, table and other details such as
legends, pictures, and texts. Available charts
include bar, column, scatter, scatter with y-axis,
histogram, Mean Kinetic Temperature and pie
charts. Properties of charts include min/max lines,
fonts, styles, colors and axis definitions.
You can configure a custom Report Header and
Footer in the report template by using Header and
Footer option in the InfoCenter Report Manager
application. The Header and Footer contents
display at the top and bottom of each report page.
Exception reporting is designed to show you just
what you need to know by excluding information
that is within range. Exception-based charts provide
min/max lines that allow you to quickly determine if
the point data is within range. Exception-based
tables allow you to filter data and only display
exceptions on a per point or per table basis.
Exceptions can be color coded to quickly identify
when out-of-range data is below or above
predefined boundaries. Data that has been modified
or annotated is displayed with a "*" to identify that
the data has been modified or includes an
annotation (note or reason for change).
Figure 10. Exception Reporting.
Statistics or batch based reporting can be
effectively deployed using the statistic table object.
This report table calculates and summarizes critical
data statistics to quickly identify performance
issues. Each parameter includes the number of
samples, min/max, average, sum, alarm count, high
point limits, low point limits and standard deviation
for the user-defined time period.
Figure 11. Statistics Reports.
Alarm Analysis reporting can be used to identify
alarm issues and summarize your systems alarm
activity. This report table calculates and
summarizes critical alarm data and statistics. Each
point includes the number of alarms, duration of
alarm and highest alarm level. Statistics for each
point include average alarm time, longest alarm
time and highest alarm level reached.