
User Manual
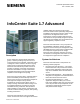
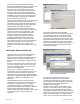
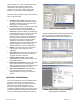
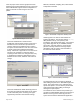
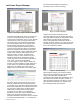
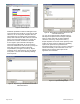
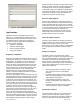

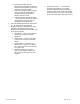
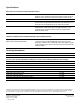
Table Of Contents
Page 6 of 10
Siemens Industry, Inc.
Figure 12. Alarm Analysis.
Additional capabilities include the Histogram Chart
report that takes the number of occurrences of data
values for one or more points and splits them into
equal-sized bins. The Mean Kinetic Temperature
(MKT) table calculates the MKT values for selected
points. This report table allows you to change the
parameters of an MKT calculation on demand.
Access rights to point information through the
InfoCenter Report Manager are set up using the
InfoCenter Administrator. This ensures you only see
point data necessary to fulfill your business
responsibilities (see Figures 13 and 14). Report
templates can be shared among users by making
them public or access can be limited by defining
them as private.
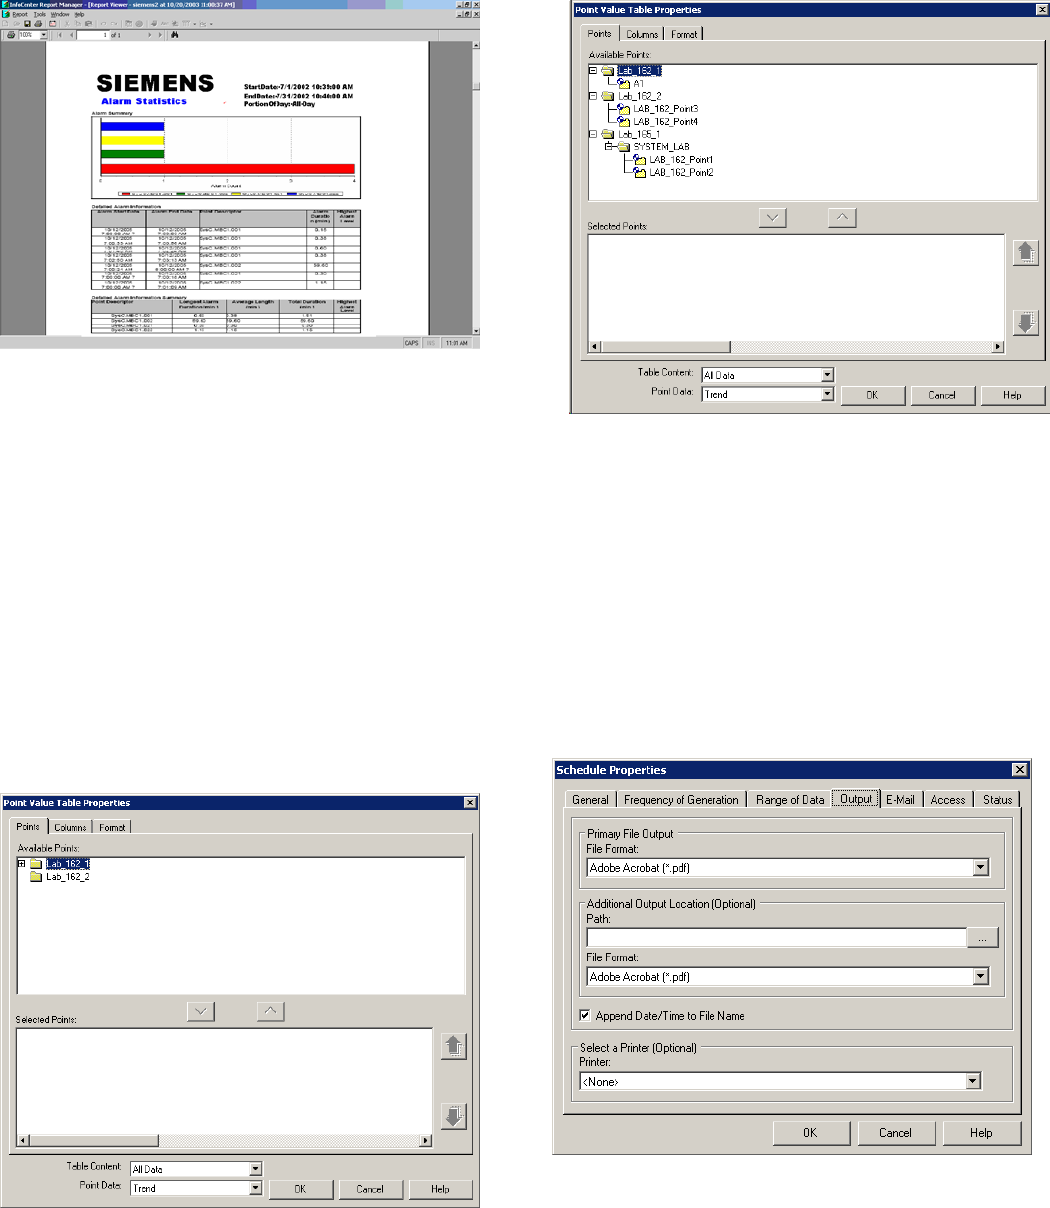
Figure 13. Report Manager Point Selection for User with
Limited Point Access.
Figure 14. Report Manager Point Selection for User with
Extensive Point Access.
You can use the Filter Report Template feature to
filter Report Templates based on Report Template
name or Owner name with or without wildcard
characters: asterisk (*) and question mark (?).
Report templates are used to create reports by either
running an ad hoc report on demand or scheduling
reports to be produced at a predefined time.
Scheduled reports can be sent to a printer, emailed or
stored electronically on the InfoCenter Server. The
Filename for the Primary File Output can be
appended with a date/time.
Figure 15. Report Scheduling Output.