
User Manual

Technical Specification Sheet
Rev. 3, March 2016
Document No. 149-483
Page 1 of 3
InfoCenter Suite Interactive
Description
Today's building automation systems are capable of
providing extensive amounts of data that hold valuable
information about a facility’s operation. Many times this
valuable information is overlooked because of the
difficulty in extracting it from overwhelmingly large data
sets. InfoCenter Suite® is the first step in solving this
problem by providing a means to automatically collect
and manage these data sets.
InfoCenter Suite Interactive is an optional application
for InfoCenter Suite Advanced or Base server and is
accessible via the InfoCenter Report Manager
software. InfoCenter Suite Interactive gives you the
ability to quickly visualize facility data using an
interactive interface and lets you dynamically
determine how information is analyzed and presented.
InfoCenter Suite Interactive provides the following
features and functions:
• Approximately 50 interactive charts that can be
changed on demand.
• Approximately 100 types of on-demand
statistical analysis functions such as curve
fitting, trend analysis, min/max/average, and
standard deviation.
• Multiple data visualization tools, including 3D,
rotation, moving and zooming of the graph,
depth adjustments, and a multitude of other
formatting options.
• Customizable presentation themes for the
graphical display.
• Copy and paste results into other Windows
applications.
• The ability to export the chart and the data used
to generate it to a number of picture and data
formats.
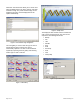
InfoCenter Suite Interactive Data
The information displayed in the InfoCenter Suite
Interactive option is a snapshot of the InfoCenter
Server Active volume along with any functions added
to the chart.
Figure 1. InfoCenter Suite Interactive Main Menu.