
User Manual

Page 2 of 3
Siemens Industry, Inc.
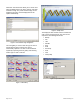
InfoCenter Suite Interactive allows you to choose from
all the available points in the Active Volume and select
a date/time range. The points and data range can be
modified at any time, and the displayed chart will
update automatically.
Figure 2. Point and data range configuration.
The chart gallery is used to select the type of chart or
function desired. Once selected, the chart is
automatically updated. The chart can be modified at
anytime by reopening the chart gallery and selecting
another type of chart or function.
Figure 3. Chart Gallery.
Figure 4. Sample chart.
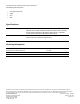
The displayed chart and data used to calculate the
chart can be exported (saved). The chart can be
exported to the following file formats:
• Bitmap
• GIF
• JPG
• Metafile
• PDF
• PNG
• Postscript
• SVG
• TIFF
• VML (HTM)
Figure 5. Export Chart Data.