
Data Sheet for Product
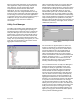
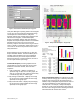
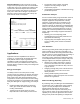
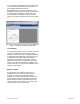
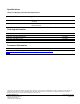
Table Of Contents

Siemens Industry, Inc.
Page 3 of 6
Figure 3. Rate Definition with Blended (Average) Cost.
Utility Cost Manager’s reporting features are designed
to turn your raw energy data into meaningful energy
consumption and cost information. Utility Cost
Manager includes five standard report templates that
fall into three categories; Load Profile Reports,
Energy Consumption Reports and Cost Allocation
Reports. Each report template includes user definable
parameters and can be run for any level of the
hierarchy. Reports at the meter level can give a micro
view of a facility’s consumption, while reports run at a
cost center or site level can provide a macro view of
utility information.
Report templates can be run adhoc or by using the
Report Scheduler Wizard. The Wizard allows you to
schedule report templates to be run at predefined
intervals based on your needs. Report schedules
define the frequency of report production, the time to
run the report and the report range.
Load Profile Reports provide a graphical view of
consumption for a 24-hour period or range of days.
Within the Load Profile formats, there are three
templates:
• Daily Load Profile – displays a single day or
specified range of days as an XY line graph, 3D
chart or YZ chart (top view). Figure 5 shows Daily
Load Profile (top view) for Office Lights.
• Daily Average Load Profile – displays an average
for the day types selected within the date range
specified; XY line graph style.
• Daily Peak Load Profile – displays the peak day(s)
for the day types selected within the date range
specified; XY line graph style.
Figure 4. Daily Load Profile Report – YZ (top view).
Figure 5. Daily Consumption Report.
Daily Consumption Reports are tabular lists of daily
totals by date and energy type. A summary shows the
totals for each energy type for the report period. In
addition, Daily Consumption Reports include charts of
cost and consumption for each component of the
selected level. For example, a Daily Consumption
Report for a Cost Center will show the daily usage for
the Cost Center along with charts showing the meters
associated with the selected Cost Center.