
User Manual

Document No. PA670IC1P6eu-en_01
Page 3 of 10
er
he burden of manually scrolling through every point in the database. The filter is
g:
ed
• Point Name wildcard
an
played system activity data. This new filter will
ake it easier for the user to sort and search through System Activity.
tion supports the following new operating system and software programs:
Center Suite Advanced) and SQL Server 2005 Express (InfoCenter Suite Base)
addition, the Siemens Cluster solution now supports SQL Server 2005 Standard Edition.
eport Objects
•
n compare May's energy
es from the previous year on the same chart.
•
e report output can now be customized
l available columns in any desired order.
•
a given reading. A histogram report is a good way to
s value varies over a given time range.
•
alculation on demand, versus having to create
ation.
•
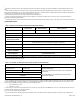
en the range of values for different data series varies widely, or when you wish to
compare mixed types of data.
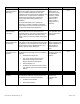
NEW FEATURE – Data Servers Filtering Capability
You can now filter the list of APOGEE and DESIGO points that are available for collection via Data Server. The new filt
will reduce setup time by eliminating t
based on one or all of the followin
• Trended or Not Trend
NEW FEATURE – System Activity Column Display and Data Filtering
In the System Activity dialog box, you can now select which columns are displayed and the order they display in. Your
selections are automatically saved, retrieved, and re-applied each time you open the System Activity dialog box. You c
also create, edit, save and delete filters which can be applied to the dis
m
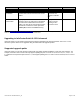
NEW FEATURE – Operating System/SQL Server Upgrades
The InfoCenter Suite 1.6.0 EU solu
• Windows 2003 Server R2
• SQL Server 2005 (Info
• Internet Explorer 7.0
In
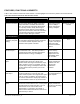
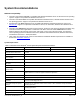
NEW FEATURE – Enhancements or additions to R
Enhancement Comparison Chart Report
The Comparison Chart Report compares the data from two different time ranges for a single point. Specified
offset time ranges include hours, days, weeks, months or years. For example, you ca
consumption values with the May valu
Enhanced Statistics Table Report
The Statistics Table Report has been updated with new features that allow you to specify three new statistic
columns (alarm count, high and low point limits) for a report. In addition, th
to display any number of the tota
New Histogram Chart Report
The Histogram Chart Report takes the number of occurrences of data values for one or more points and splits
them into equal-sized bins. You can define the bin size or have the bins sized automatically. For each point, the
frequency (number of counts per bin) is shown by a column. The Histogram chart can be used to show the
distribution of a point or how many times per period it is at
show how a point’
New MKT Table
This new table displays Mean Kinetic Temperature (MKT) values for selected points. MKT is a calculated
temperature value that includes the effects of temperature variations over a period of time. It expresses the
cumulative thermal stress experienced by a product at varying temperatures during storage and distribution.
This report table allows you to change the parameters of an MKT c
a new Summary point in the InfoCenter Administrator applic
New Secondary Y-Axis Added to Scatter Chart Report
The Scatter Chart Report has been updated to give you the ability to plot one or more data series on a secondary
value (y) axis. This is useful wh