
User Manual


Document No. PA670IC1P6eu-en_01
Page 4 of 10
U highlights several new key features and enhancements.
Features o uite Revision 1.6.0 EU
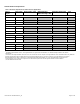
FEATURES, FUNCTIONS & BENEFITS
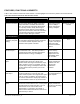
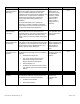
Table 1. New Features of InfoCenter Suite Revision 1.6.0 E
Table 1. New f InfoCenter S
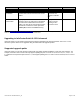
FEATURE FUNCTION BENEFITS DEPENDENCIES
New Options
InfoCenter Interactive
nteractive
is an optional feature that is accessible via the
analyze data without
creating a template.
InfoCenter Version
1.6.0 EU
This new option allows the ability to view and
analyze data that is available with InfoCenter
Suite. The InfoCenter Interactive option allows
you to quickly visualize facility data using an
interactive interface that lets you dynamically
analyze and present data. InfoCenter I
InfoCenter Report Manager software.
Saves time by giving
users the ability to
New Client Features
Import/Export Report
Templates (Template
Mobility)
now
that allows
you to transfer custom templates from one
InfoCenter Suite system to another.
ent
m other
InfoCenter Database
None
The InfoCenter Report Manager application
has a template export/import feature
Reduces installed
costs for developm
of reports. Can import
reports fro
systems.
Emission Summary
Standard Report a
standard report format that tracks greenhouse
emissions based on energy consumption. nd
sustainability efforts
None
This is a report-add in that is included with the
core InfoCenter Suite. This add-in provides
Provides standard
(versus custom)
reporting option to
support Green a
such as LEED.
Comparison Chart
Object
's energy consumption values with
the May values from the previous year on the
ance
r time
te
performance
baselines.
None The Comparison Chart compares the data from
two different time ranges for a single point.
Specified offset time ranges include hours, days,
weeks, months or years. For example, you can
compare May
same chart.
Allows users to
analyze perform
variations ove
and genera
Enhanced Statistics
Table Object
can now be customized to display any number of
isplay
new statistical data in a
report template.
None
The Statistics Table has been updated with new
features that allow you to specify three new
statistic columns (alarm count, high and low point
limits) for a report. In addition, the report output
the total available columns in any desired order.
Allows users to d
Histogram Chart
Object
of
e points
nt, the number of
values from the dataset that fall into each bin are
represented by a column.
ance
over time by visualizing
trends in data.
None
The Histogram Chart Report takes the number
occurrences of data values for one or mor
and splits them into equal-sized bins. You can
define the bin size or have the bins sized
automatically. For each poi
Allows users to
analyze perform