Minimizing Excessive Sound in Ventilation System Design s
Minimizing Excessive Sound in Ventilation System Design Application Guide 125-1929 Rev. 4, June, 2009 Siemens Building Technologies, Inc.
Rev.4, June, 2009 NOTICE Document information is subject to change without notice by Siemens Building Technologies, Inc. Companies, names, and various data used in examples are fictitious unless otherwise noted. No part of this document may be reproduced or transmitted in any form or by any means, electronic or mechanical, for any purpose, without the express written permission of Siemens Building Technologies, Inc.
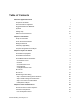
Table of Contents About this Application Guide I Purpose of this Guide I How this Guide is Organized I Suggested Reference Materials II Symbols III Getting Help III Where to Send Comments III Chapter 1–Introduction 1 Scope of This Guide 1 HVAC Sound Transmission 2 Background Sound 2 Laboratory Applicability 2 Computer Program Sound Analysis 2 Chapter 2–Physics of Sound 5 Sound Wave Propagation 5 Sound Wave Parameters 6 Sound Measurement Parameters 8 Sound Power Level Decibe
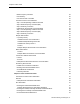
Purpose of this Guide Blade Frequency Increment Fan Efficiency Fan Sound Power Level Data Fan Sound Power Level Calculation 24 25 25 26 Step 1. Actual Operating Conditions Increase Step 2. Blade Frequency Increment (BFI) Step 3. Efficiency Correction Example Fan Sound Power Level Calculation Step 1. Actual Operating Conditions Increase Step 2. Blade Frequency Increment (BFI) Step 3.
About this Application Guide Round Acoustically Lined Sheet Metal Ducts Duct Elbows Example Rectangular Duct Elbow Attenuation Calculation Duct Takeoffs and Divisions 57 58 60 60 Duct Silencers 62 End Reflection 62 Environment Adjustment Factor 63 Space Effect 63 Radiated Sound Attenuation 64 Chapter 5–HVAC System Sound Analysis 67 Introduction to HVAC System Sound Analysis 67 Example HVAC System Sound Analysis Step 1. Actual Operating Conditions Increase Step 2.
Purpose of this Guide Chapter 6–Minimizing HVAC Sound Introduction to Minimizing HVAC Sound 95 Basic System Design Criteria 95 Fans 96 Duct Configurations 97 Terminal Equipment 97 Sound Attenuation Devices 100 Passive Sound Attenuation Devices Linings Duct Silencers and Attenuators Ceiling and Wall Absorbers Enclosures Active Sound Attenuation Devices Sound Measurement Instrumentation 100 100 100 101 101 101 103 Sound Measurement Procedure Appendix iv 95 103 105 NC and RC Curves, Tabular
About this Application Guide This section discusses the following topics: • Purpose of this guide • How this guide is organized • Suggested reference materials • Conventions and symbols used It also provides information on how to access help and where to direct comments about this guide.
About this Application Guide • Chapter 6, Minimizing HVAC Sound, offers general guidance on minimizing excessive or objectionable HVAC sound. • The Appendix contains blank copies of certain graphs and forms that appear in this document. They are intended to be copied and used for sound measurement and analysis. • The Glossary describes the terms and acronyms used in this manual. • The Index helps you locate information presented in this application guide.
Symbols • Department of Labor, Occupational Safety & Health Administration, Superintendent of Documents, U.S. GPO: − Occupational Exposure to Hazardous Chemicals in Laboratories; Final Rule, 29 CFR Part 1910, 1990 Symbols The following table lists the symbols used in this guide to draw your attention to important information. Notation Symbol Meaning WARNING: Indicates that personal injury or loss of life may occur to the user if a procedure is not performed as specified.
About this Application Guide IV Siemens Building Technologies, Inc.
Chapter 1–Introduction Chapter 1 introduces laboratory control and safety solutions. It includes the following topics: • Scope of this guide • HVAC sound transmission • Background sound • Laboratory applicability • Computer program sound analysis Scope of This Guide This application guide focuses on HVAC air movement and distribution system generated sound.
Chapter 1–Introduction HVAC Sound Transmission Ventilation system ductwork conducts or transmits sound in the same way that any conduit can convey sound. We’re all familiar with how effectively a hose or pipe can conduct the sound waves of the human voice. In the same way, ductwork conducts fan noise, and other component sounds to the areas served.
Computer Program Sound Analysis Siemens Building Technologies, Inc.
Chapter 2–Physics of Sound Chapter 2 discusses the properties of sound and how sound is measured. It includes the following topics: • Sound wave propagation • Sound wave parameters • Sound measurement parameters • NC Curves • RC Curves • Determining an RC rating Sound Wave Propagation The human ear hears or senses sound when oscillations or vibrations occur within its hearing mechanism.
Chapter 2–Physics of Sound This experiment also shows another important element of sound wave transmission; that sound waves traveling through air are not dependent upon movement of the air itself. Although the air in the bell jar could not leave the jar, the sound traveled outward from the jar without involving any physical movement of the air out from the inside of the bell jar. Likewise, sound movement in a ventilation system is not dependent upon the movement or direction of the airflow.
Sound Wave Parameters Unless there is a barrier, the sound waves continue to travel outward in all directions in a spherical manner, until they either are absorbed by an object or their energy level is dissipated by the surrounding air. With regard to understanding the science of sound and its effects, it is necessary to have an understanding of two fundamental terms: sound power and sound pressure. These terms are not interchangeable and it is important to have a clear understanding of each term.
Chapter 2–Physics of Sound The sound pressure level is the most widely used parameter in the field of acoustical engineering since it is the closest thing to what we experience in terms of loudness or softness of a sound. In the previous analogy, the thickness of the paint coating on the spherical surface represented the effect that a certain quantity of paint could have on the surface of the sphere.
Sound Measurement Parameters We could improve the situation by using a direct comparison or ratio between the two different sound power levels. For example, when comparing a normal voice to a whisper, we could divide 10-5 by 10-9 that would yield 10,000. In other words, a normal voice has about 10,000 times more sound power than a whisper. This same approach would also tell us that the sound power from a jetliner takeoff is 1,000,000,000 times more sound power than a normal voice.
Chapter 2–Physics of Sound The following formula will yield the decibels for any absolute value of sound power that we compare to the threshold of hearing: Lw = 10 x Log (W ÷ Wref) Where: Lw = the sound power level in dB. W = the power of the specific sound in watts. Wref = the reference point and is always 10-12 watts. Using this formula, let’s determine the sound power level of a whisper, which produces a very tiny amount of sound power around 0.000000001 watts (10-9 watts).
Sound Measurement Parameters Again, there are no units associated with decibels since they are a comparison between two values, (or more scientifically, a ratio between different magnitudes). Also, decibels are used for different parameters besides sound power level. Decibels are also used to express sound pressure level, which is discussed below, and as we are keenly aware, is a different sound parameter than the sound power level.
Chapter 2–Physics of Sound = 60 dB Therefore, the sound pressure level of normal conversation for the listener is approximately 60 dB. To give a “feel” for the common range of values for both sound power and sound pressure, Table 1 gives some typical values for the common levels in our environment. Table 1. Common Sound Power & Sound Pressure Levels.
Sound Measurement Parameters Figure 2 illustrates another important rule regarding sound pressure levels and distance. Whenever the distance between a sound source and a receiver is doubled, the sound pressure level at the receiver is reduced by 6 dB from its previous value. This is a very important relationship.
Chapter 2–Physics of Sound Previously, we discussed the terms sound power level and sound pressure level and arrived at how their intensity was expressed in decibels. If you recall how the screen of an oscilloscope looks when it’s monitoring the audio output of a speaker, you can visualize that sounds are usually composed of a multitude of tones at different frequencies.
Sound Measurement Parameters Note that a solid line curve in the lower left portion of the graph is labeled as the approximate threshold of a hearing curve. This represents the dB sound pressure level that must be present in a person’s eardrum in order for the person to hear a particular sound frequency. Recall that in Table 1, the threshold for hearing is listed as 0 dB sound pressure level.
Chapter 2–Physics of Sound Figure 4 shows the resulting sound pressure level when combining the two curves of Figure 3 using Table 3. Note that where the individual curves of Figure 1 are more than 16 dB apart, the resultant always equals the higher dB value of the individual curves. Incidentally, the resulting sound produced by the combined sound curve of Figure 4 would be a combination of a rumble and hiss and would still be objectionable as an ambient sound. Figure 4.
NC Curves Avoid using A-Weighted sound criterion when designing HVAC systems or conducting a detailed analysis of the sound pressure level in a room with the intent of improving the room ambient sound profile. Using A-Weighted values should be limited only to general noise level comparison measurements or when involved in ensuring against exceeding permissible occupational sound levels.
Chapter 2–Physics of Sound (See the Appendix for a copy of this graph that is suitable for reproduction.) Figure 5. Noise Criterion Curves. RC Curves The Room Criterion (RC) rating is a more recent development for analyzing and rating the sound present in a room. The RC rating should be used, whenever possible, in specific design applications since it is superior to the NC curves for the following reasons: 1.
RC Curves • If an identifiable predominant tone exists in the sound (such as, clicking, whining, whistle, etc.), a T is also added to the above suffix. • If excessive vibration is present, a V suffix is also added to the above. Figure 6 shows the standard family of Room Criterion curves. Table 4 lists specific applications and the maximum acceptable sound criterion that apply when referencing these curves.
Chapter 2–Physics of Sound (See the Appendix for a copy of this graph that is suitable for reproduction.) Figure 6. Room Criterion Curves. Determining an RC Rating To determine what RC rating should be applied to an existing room, follow the steps listed below. Step 1. Measure Existing Sound Pressure Measure the existing sound pressure level in the room in decibels at all of the octave band center frequencies. Calculate an average dB value from the room dB values obtained at 500, 1,000, and 2,000 Hz.
Determining an RC Rating Step 3. Plot Curve of Octave Band Plot an actual curve of all of the octave band frequencies obtained in Step 2 on the graph, and compare this curve with the reference curve drawn in Step 2. • If the actual curve does not depart from the reference curve throughout all octave bands by more than 5 dB, the actual curve is considered to be neutral. The suffix N is added to the value obtained in Step 1.
Chapter 2–Physics of Sound Figure 7. Actual Room Sound Profile Curve vs. RC Reference Curve. 22 Siemens Building Technologies, Inc.
Chapter 3–HVAC Sound Sources Chapter 3 discusses sources of sound associated with HVAC systems. It includes the following topics: • Sources of sound in HVAC systems • Fan sound components • Fan sound power level calculation • Damper airflow noise • Elbow airflow noise • Junction and takeoff airflow noise • Air delivery device noise Sources of Sound in HAVC Systems Sound associated with HVAC systems and equipment is generated from multiple sources.
Chapter 3–HVAC Sound Sources HVAC aerodynamic sound is somewhat harder to attenuate since the ductwork provides a direct conduit for its transmission to the conditioned spaces. In addition, some aerodynamic sound is generated locally by HVAC system supply and exhaust components associated with the room served by the system. On the supply side, this includes VAV box dampers, reheat or cooling coils, air diffusers, and associated duct fittings.
Fan Sound Components Although a fan is not designed with the intention of deliberately creating sound, a sound component, in addition to aerodynamic sound, is nonetheless generated as the result of fan blade vibration during rotation. This component of fan sound is referred to as the blade frequency increment (BFI). In some situations this component of the fan sound can be the major source of annoyance.
Chapter 3–HVAC Sound Sources Fan Type Propeller All Sizes 63H z 125H z 250H z 500H z 1kH z 2kH z 4kH z 8kH z BFI 48 51 58 56 55 52 46 42 5 In Table 5, the sound power levels listed are quite low with respect to those listed in Table 1 for sources of sound. However, the values in Table 5 are only a starting point. They only cover fan operation at 1 cfm and 1.00 inches water static pressure (wsp).
Fan Sound Power Level Calculation When the frequency is determined, refer to Table 6 to determine the octave band to which this frequency applies. The BFI dB value from the manufacturer (or from Table 5) is then added to the dB obtained in Step 1 for this particular octave band. Table 6. Octave Band Frequency Division. (Octave band is listed above the applicable frequency range) Step 3.
Chapter 3–HVAC Sound Sources Figure 8. Fan Sound Power Level Correction for Off-Peak Efficiency Operation. Example Fan Sound Power Level Calculation Assume an HVAC system design will use a 30-inch diameter backward inclined 10 blade centrifugal fan to deliver 15,000 cfm at a static pressure of 4.00 in. WC. According to manufacturer’s data, this requires the fan to rotate at 1,300 rpm.
Fan Sound Power Level Calculation Step 2. Blade Frequency Increment (BFI) Using the Hz formula, the frequency at which the blade sound component will occur is: Hz = Fan RPM x (Number of Blades ÷ 60) Hz = 1300 x (10 ÷ 60) Hz = 1300 x (0.167) Hz= 217 Referring back to Table 6, since 217 Hz is within the 250 Hz octave band, the BFI value of 3 dB (obtained from the rightmost column of Table 5) is added to the 250 Hz octave band column in our summary chart on the next page. Step 3.
Chapter 3–HVAC Sound Sources Note that although a fan is normally the major sound producer, you should also analyze the entire system of ductwork, terminal devices and the room diffusers to determine what their contribution to the HVAC system aerodynamic sound they may make, as well as what attenuation they may provide. Analyzing a duct system’s components for the purpose of determining the attenuation factors of each separate element is covered later in this document.
Damper Airflow Noise C = 15.9 x 10⁶ DP S2 ÷ Q2 Where: DP = the pressure drop across the damper from the manufacturer’s data. S = the duct area at the damper in square feet Q = the CFM. In lieu of S2/Q2, the term 1/V2 may be substituted, where V is the air velocity in feet/minute. Calculate Damper Blockage Factor BF To calculate damper blockage factor BF for a multi-blade damper, use the following formula: If C ≠ 1, BF = (C½ -1) ÷ (C - 1) If C = 1, BF = 0.
Chapter 3–HVAC Sound Sources Figure 9. Velocity Term U, For Dampers. K Factor The K factor is determined by first calculating the Strouhal number, and then referring to the Strouhal Graph in Figure 10, or using the following separate K equations. Since the Strouhal number is dependent upon the octave band frequency, a separate Strouhal number (St) and K factor must be determined for each of the eight octave bands.
Damper Airflow Noise Figure 10. Characteristic Spectrum K vs. Strouhal Number for Dampers. Example of Damper Sound Power Level Calculation Assume a rectangular opposed blade control damper is to be used to control duct static pressure in a 48 inches wide x 24 inches high supply system duct. The system is designed to provide 20,000 cfm at a 0.3 in. WC gauge pressure drop across the damper. Determine the sound power level that the damper will produce under these conditions.
Chapter 3–HVAC Sound Sources K requires solving for the Strouhal number at each octave band center frequency and then using the graph in Figure 10 to determine K. St = 60FD÷ U St= 60 x 63 Hz x 2 ft. ÷ 4,650 = 1.6, K = -39 St= 60 x 125 Hz x 2 ft. ÷ 4,650 = 3.2, K = -42 St= 60 x 250 Hz x 2 ft. ÷ 4,650 = 6.4, K = -45 St= 60 x 500 Hz x 2 ft. ÷ 4,650 = 12.8, K = -48 St= 60 x 1,000 Hz x 2 ft. ÷ 4,650 = 25.6, K = -52 St= 60 x 2,000 Hz x 2 ft. ÷ 4,650 = 51.2, K = -63 St= 60 x 4,000 Hz x 2 ft. ÷ 4,650 = 102.
Elbow Airflow Noise Where: ELw = the net elbow sound power level increase (or decrease if it is negative). K = a factor that is dependent upon the elbow operating conditions. F = the octave band center frequency in Hz. U = the duct airflow velocity. S = the duct cross sectional area in square feet. D = the height of the elbow in feet for elbows without turning vanes. D = the cord length of a vane in feet for elbows with turning vanes.
Chapter 3–HVAC Sound Sources Figure 11. K versus Strouhal Number for Elbows. Once the Strouhal numbers are calculated for each octave band, see Figure 12 to obtain the K factors. The K factors may also be calculated using the following formulae: For elbows with turning vanes: K = - 47.5 - 7.69 (Log St)2.5 For elbows without turning vanes: K = - 9.22 - 16.48 (Log St) - 5.
Elbow Airflow Noise Determine the values for the terms in the Elbow Sound Power Level (DLw) formula: ELw = K + 10 Log F + 50 Log U + 10 Log S + 10 Log D – EC Where: F = the octave band center frequency in Hz: (63, 125, 250, 500, 1,000, etc.). U = the airflow velocity (12,000 cfm/6 sq ft = 2,000 fpm). S = the duct area sq. ft. (36 in. x 24 in. =3 ft x 2 ft = 6 sq ft). D = the vane cord length in feet (0.8 ft.). For an elbow with turning vanes, EC = 10 Log n – 107 = 10( 1.18) - 107 = 11.8- 107 = -95.2.
Chapter 3–HVAC Sound Sources In Table 9, the ELw values are all positive, so this elbow adds to the sound power level produced by the HVAC system. If this elbow was located within a short distance from the Example Fan Sound Power Level Calculation, the net change in the total sound power level would not perceptibly change since the fan’s sound power level was significantly higher by a range of 16 to 51 dB throughout the octave bands.
Junction and Takeoff Airflow Noise When the Strouhal numbers are calculated for each octave band, use Figure 12 to obtain the K factors. Before using Figure 12, the velocity ratio M, between main duct airflow velocity (UM) and branch duct airflow velocity (UB) is calculated as: M = UM ÷ U B The K factors may also be calculated using the following very lengthy formula: K = -21.6 + 12.4 M0.67 - 16.5 M-0.3 (Log St) 5.0 M-0.25 (Log St)2 Figure 12. K versus Strouhal Number for Junctions.
Chapter 3–HVAC Sound Sources Where: Δr = Junction Radius/Branch Duct Diameter. = r ÷ DBR Note that for duct junctions and takeoffs without a radius, Δr is 0.0. However for duct junctions and takeoffs with a radius, Δr is greater than zero, and reduces the sound power level generated at the junction. For junctions and takeoffs with a radius, the Δr values must be corrected for each octave band.
Junction and Takeoff Airflow Noise Figure 13. Final Corrected Δr Factors for Duct Junctions and Takeoffs with a Radius. Determine the values for the terms in the Junction Sound Power Level DLw) formula: JLw = K + 10 Log F + 50 Log UB + 10 Log S+ 10 Log D – JC Where: F = the octave band center frequency in Hz: (63, 125, 250, 500, 1,000, etc.). UB = the branch duct air velocity: (1,600 cfm / 1 sq ft = 1,600 fpm). S = the branch duct area: (1 sq ft). D = the branch duct height: (1 ft).
Chapter 3–HVAC Sound Sources Therefore: M = 2,420 ÷ 1,600 M = 1.5 St = 60 F D ÷ UB St = 60 x 63 Hz x 1 ft ÷ 1,600 = 2.4, K = -11 St =60 x 125 Hz x 1 ft ÷ 1,600 = 4.7, K = -18 St =60 x 250 Hz x 1 ft ÷ 1,600 = 9.4, K = -24 St = 60 x 500 Hz x 1 ft ÷ 1,600 = 18.8, K = -30 St = 60 x 1,000 Hz x 1 ft ÷1,600 = 37.5, K = -40 St = 60 x 2,000 Hz x 1 ft ÷1,600 = 75.0, K = -49 St = 60 x 4,000 Hz x 1 ft ÷ 1,600 = 150.0, K = -57 St = 60 x 8,000 Hz x 1 ft ÷ 1,600 = 300.
Air Delivery Device Sound In Table 11, the JLw values are all positive, so this takeoff adds to the sound power level produced by the HVAC system. Since a takeoff is normally near an occupied area, its sound power level will likely have an impact on the HVAC sound in the area. Note that the higher the Strouhal number, the lower the net sound power level will be.
Chapter 3–HVAC Sound Sources There will be little opportunity for sound attenuation after the diffuser. Many air diffusers are available with an integral throttling damper as part of the diffuser. Since the throttling damper has the potential for generating airflow sound, this must also be taken into account with reference to the air diffuser’s sound rating. Therefore, whenever a diffuser has a throttling damper in its collar, the following increases to the dB values in Table 9 apply: +5 dB for a 0.
Air Delivery Device Sound Sound Breakout and Break-in Aerodynamic sound that has sufficiently high energy within a duct can also be heard outside of the duct. If you were on a ladder extending above a ceiling where HVAC equipment is located, you might hear the sound of the air passing across a damper or even the rumble of an upstream fan. The sound is radiated directly to us and is referred to as breakout sound.
Chapter 4–HVAC Sound Attenuation Chapter 4 discusses the attenuating effect of common HVAC system elements (also referred to as transmission loss or insertion loss).
Chapter 4–HVAC Sound Attenuation As previously discussed, sound travel is independent of the direction of airflow. Therefore, all calculations involving sound generation or attenuation apply to the exhaust portion of an HVAC system as well as to the supply side. Plenums Plenums that are constructed of concrete will have virtually negligible attenuation effect on sound generated by HVAC components. Plenums of unlined sheet metal will provide only a little more attenuation effect than concrete.
Plenums Figure 14. Relative Sound Absorbing Capabilities of Various Plenum Lining Material. The following is a simplified formula that can be used to determine the approximate attenuation a plenum will provide: Plenum attenuation dB = Lf + {-10 Log [Ae (1 ÷ 6.283 d2) + Ae (1 -a)/(a * Aw)]} Where: Lf = Low frequency factor: 7 at 63 Hz, 6 at 125 Hz, and 1 at 250 Hz. Ae = Area of plenum exit in square feet. Aw = Area of sound absorption material on plenum walls in square feet.
Chapter 4–HVAC Sound Attenuation Area of the outlet is: 3 ft x 4 ft = 12 ft2 Area of the inlet is: 3 ft x 3 ft = 9 ft2 Area of each plenum end is: 6 ft x 6 ft = 36 ft2 Net Area of outlet is: 36 ft2 - 12 ft2 = 24 ft2 Net Area of inlet end is: 36 ft2 - 9 ft2 = 27 ft2 Area of plenum sides is: 12 ft x (6 ft + 6 ft + 6 ft + 6 ft) = 12 ft x (24 ft) = 288 ft2 Total plenum acoustically lined area is: 24 ft2 + 27 ft2 + 288 ft2 = 339 ft2 From the 2-inch Thick Fiberglass row in Table 13 we get the sound absorption co
Duct Attenuation Table 15. Approximate dB Attenuation for Each Octave Band. 63 125 250 500 1,000 2,000 4,000 8,000 Hz Hz Hz Hz Hz Hz Hz Hz 14.4 dB 14.4 dB 16.7 dB 17.2 dB 17.2 dB 17.2 dB 17.2 dB 17.2 dB Note that when the sound absorption coefficients are the same (as they are for 500 Hz and higher in this example), the attenuation level is the same.
Chapter 4–HVAC Sound Attenuation First calculate the P/A ratio: P = (48 in. + 36 in. + 48 in. + 36 in. ) ÷ 12 in./ft = 168 ÷ 12 = 14 feet A = (48 in. x 36 in.) ÷ 144 sq in./sq ft = 1728 ÷ 144 = 12 sq ft P/A = 14 ÷ 12 = 1.17 With reference to Table 16, the following dB attenuation factors per foot can be interpolated: P/A 1.17 63 125 250 500 1,000 2,000 4,000 8,000 Hz Hz Hz Hz Hz Hz Hz Hz .166 .112 .075 .050 .033 .022 .015 .
Duct Attenuation P/A 63 125 250 500 1,000 2,000 4,000 8,000 Hz Hz Hz Hz Hz Hz Hz Hz 1.75 .223 .150 .100 .067 .045 .030 .020 .013 1.70 .219 .147 .098 .066 .044 .029 .020 .013 1.60 .209 .140 .094 .063 .042 .028 .019 .012 1.50 .199 .134 .090 .060 .040 .027 .018 .012 1.40 .190 .127 .085 .057 .038 .026 .017 .011 1.30 .180 .121 .081 .054 .036 .024 .016 .011 1.25 .175 .117 .078 .053 .035 .024 .016 .010 1.20 .169 .114 .076 .051 .
Chapter 4–HVAC Sound Attenuation Rectangular Acoustically Lined Sheet Metal Ducts Rectangular ducts internally lined with at least one-inch thick fiberglass or similar material are very effective at attenuating sound, particularly in the mid frequencies. Recall from Figure 14 on plenum lining, that fiberglass dramatically increases sound attenuation in the upper octave bands. Also 2-inch thick fiberglass is significantly superior to the 1-inch thick material particularly in the lower octave bands.
Duct Attenuation P/A 63 125 250 500 1,000 2,000 4,000 8,000 Hz Hz Hz Hz Hz Hz Hz Hz 9.00 1.28 1.43 1.75 3.16 8.27 8.22 4.21 2.67 8.40 1.16 1.32 1.66 3.05 7.80 7.78 4.07 2.63 8.00 1.08 1.24 1.60 2.98 7.62 7.48 3.98 2.60 6.40 0.82 0.96 1.35 2.66 6.52 6.26 3.59 2.46 6.00 0.77 0.90 1.29 2.57 6.23 5.94 3.49 2.42 5.33 0.69 0.79 1.18 2.42 5.74 5.41 3.31 2.36 5.00 0.65 0.74 1.12 2.34 5.49 5.13 3.21 2.32 4.80 0.63 0.71 1.09 2.29 5.
Chapter 4–HVAC Sound Attenuation Table 18. Two-Inch Thick Fiberglass Lined Rectangular Duct Attenuation Per Foot of Length. P/A 56 63 125 250 500 1,000 2,000 4,000 8,000 Hz Hz Hz Hz Hz Hz Hz Hz 12.00 2.00 2.06 2.18 3.66 10.10 10.36 4.80 2.87 11.00 1.75 1.86 2.05 3.51 9.51 9.66 4.61 2.81 10.00 1.49 1.63 1.89 3.33 8.90 8.95 4.41 2.74 9.00 1.28 1.43 1.75 3.16 8.27 8.22 4.21 2.67 8.40 1.16 1.32 1.66 3.05 7.80 7.78 4.07 2.63 8.00 1.08 1.24 1.
Duct Attenuation P/A 63 125 250 500 1,000 2,000 4,000 8,000 Hz Hz Hz Hz Hz Hz Hz Hz 0.95 0.16 0.15 0.32 1.01 1.72 1.35 1.50 1.58 0.86 0.14 0.14 0.30 0.96 1.61 1.25 1.43 1.55 0.83 0.14 0.13 0.29 0.94 1.58 1.22 1.42 1.54 Round Unlined Sheet Metal Ducts While unlined round ducts provide the least amount of sound attenuation, nevertheless their attenuating effect should be included when designing a duct system.
Chapter 4–HVAC Sound Attenuation Diamete r 63 125 250 500 1,000 2,000 4,000 8,000 Inches Hz Hz Hz Hz Hz Hz Hz Hz 12 0.23 0.46 0.81 1.45 2.18 1.91 1.48 1.05 14 0.19 0.42 0.77 1.43 2.14 1.79 1.34 1.00 16 0.16 0.38 0.73 1.40 2.08 1.67 1.21 0.95 18 0.13 0.35 0.69 1.37 2.01 1.56 1.10 0.90 20 0.11 0.31 0.65 1.34 1.92 1.45 1.00 0.87 22 0.08 0.28 0.61 1.31 1.82 1.34 0.92 0.83 24 0.07 0.25 0.57 1.28 1.71 1.24 0.85 0.80 26 0.05 0.
Duct Attenuation Table 21. Two-Inch Thick Fiberglass Lined Round Duct Attenuation Per Foot of Length. Diamete r 63 125 250 500 1,000 2,000 4,000 8,000 Inches Hz Hz Hz Hz Hz Hz Hz Hz 6 0.56 0.80 1.37 2.25 2.17 2.31 2.04 1.26 8 0.51 0.75 1.33 2.23 2.19 2.17 1.83 1.18 10 0.46 0.71 1.29 2.20 2.20 2.04 1.64 1.12 12 0.42 0.67 1.25 2.18 2.18 1.91 1.48 1.05 14 0.38 0.63 1.21 2.15 2.14 1.79 1.34 1.00 16 0.35 0.59 1.17 2.12 2.08 1.67 1.21 0.
Chapter 4–HVAC Sound Attenuation Frequency is in Hz Width is in inches. When the FW values are determined, refer to the appropriate curve in Figure 15 to determine the dB attenuation at each octave band. Example Rectangular Duct Elbow Attenuation Calculation An unlined duct is 36 inches wide by 28 inches high. Determine the attenuation at each octave band provided by a square elbow that has turning vanes.
Duct Takeoffs and Divisions Once the term enclosed within the parenthesis is calculated, Figure 17 provides dB values. For example, assume that a 36-inch x 18-inch rectangular duct main has an 8-inch round 90 degree takeoff that is followed by a 32-inch x 18-inch continuation of the duct main. What attenuation would this junction provide for the 8-inch and the reduced sized main? Attenuation for an 8-inch diameter duct: = 10 Log [8 in. Duct Area ÷ Total Area Lv. Jct.] = 10 Log [50.3 in.2 ÷ (50.3 in.
Chapter 4–HVAC Sound Attenuation Duct Silencers Conventional duct silencers consist of prefabricated arrangements of sound absorbing material intended for insertion within a duct run to attenuate sound. They offer only limited attenuation in the low frequency (125 Hz and below) octave bands, and moderate attenuation at the high frequency bands. Their maximum attenuation is in the mid frequency (that is, 1,000 Hz) octave bands.
Environment Adjustment Factor 14 in. dia. 11.5 6.6 3.0 1.0 0.3 0 0 0 16 in. dia. 10.5 5.8 2.5 0.8 0.2 0 0 0 18 in. dia. 9.6 5.1 2.1 0.7 0.2 0 0 0 20 in. dia 8.8 4.5 1.8 0.6 0.1 0 0 0 6 in. sq. 17.2 11.8 6.8 3.1 0.3 0.1 0 0 8 in. sq. 14.9 9.7 5.1 2.1 0.2 0 0 0 10 in. sq. 13.2 8.1 3.9 1.5 0.1 0 0 0 12 in. sq. 11.7 6.9 3.1 1.1 0 0 0 0 14 in. sq. 10.6 5.9 2.5 0.8 0 0 0 0 16 in. sq. 9.6 5.1 2.1 0.7 0 0 0 0 18 in. sq. 8.
Chapter 4–HVAC Sound Attenuation A room’s ability to attenuate the sound to an acceptable level is dependent upon its size, shape, ceiling height, acoustical properties, and other factors. The following equation (referred to as the Schultz equation) provides the means to calculate the attenuation and the resulting sound pressure level at a given location from a sound source. RLp = 5 Log (V) + 10 Log (r) - 25 + 3 Log (f) Where: V = Room Volume. R = Distance to the sound source (feet).
Radiated Sound Attenuation Radiated sound is essentially the breakout component of the sound generated by the device and has the potential of entering the room primarily on a direct path. Most often this component of sound energy must penetrate a dropped ceiling or other architectural features before entering a room.
Chapter 5–HVAC System Sound Analysis Chapter 5 provides examples of how to analyze the components of a specific HVAC system. It includes the following topics: • Introduction to HVAC system sound analysis • Commentary on HVAC system sound Introduction to HVAC System Sound Analysis Earlier in this document, we discussed the sound generated by and attenuated by individual HVAC components.
Chapter 5–HVAC System Sound Analysis Figure 16. HVAC System Layout for Sound Analysis Example. Step 1. Actual Operating Conditions Increase This calculation provides the sound pressure level increase for the fan at the actual operating cfm and static pressure. Using the FLw formula, will yield the dB level increase that must be added to each of the eight octave bands. FLw = 10 Log Q + 20 Log P = 10 Log 15,000 + 20 Log 3 = 10 (4.2) + 20 (0.477) = 42 + 9.5 = 51.5 This value is in the second row of Table 26.
Introduction to HVAC System Sound Analysis Step 2. Blade Frequency Increment (BFI) This calculation uses the Hz formula to determine the frequency at which the blade sound component occurs. Hz = Fan rpm x (Number of Blades ÷ 60) Hz = 1,225 x (10 ÷ 60) Hz = 1,225 x 0.167 Hz = 204 Referring back to Table 6, the 204 Hz is within the 250 Hz octave band. Therefore, the BFI value of 3 dB (from Table 5) is added as a contributing component of sound power level of the 250 Hz octave band. Step 3.
Chapter 5–HVAC System Sound Analysis Duct Section A Airflow in the velocity range typically used in HVAC systems does not generate appreciable sound within straight duct runs; therefore, no generated noise level (GNL) calculation procedure was given in an earlier section. Rather, ducts may be assumed to only attenuate the sound generated by other duct elements.
Introduction to HVAC System Sound Analysis Where: ELw = the net elbow sound power level increase (or decrease if it is negative). K = a factor that is dependent upon the elbow operating conditions. F = the octave band center frequency in Hz. U = the duct airflow velocity = 15,000/12 = 1,250 ft/min. S = the duct cross sectional area in square feet = 12 sq ft as calculated previously. For elbows with turning vanes: D = the cord length of a vane in feet (9.6 in. = 0.8 ft). EC = a constant.
Chapter 5–HVAC System Sound Analysis 63 125 250 500 1,000 2,000 4,000 8,000 Hz Hz Hz Hz Hz Hz Hz Hz EC -95 -95 -95 -95 -95 -95 -95 -95 ELw 40 41 39 35 28 18 4 0 dB dB dB dB dB dB dB dB* * Although this value adds up to -14 dB, a zero is entered as the net result since it is considered that a GNL cannot be less than zero. These values are now entered into the HVAC system - sound analysis form (Figure 17) as Elbow B “GNL” entries.
Introduction to HVAC System Sound Analysis dB dB dB dB dB dB dB dB Multiplying these values by the 6 feet yields the following attenuation in each octave band: 63 125 250 500 1,000 2,000 4,000 8,000 Hz Hz Hz Hz Hz Hz Hz Hz 1.0 dB 0.7 dB 0.4 dB 0.3 dB 0.2 dB 0.1 dB 0.1 dB 0.1 dB These values are entered into the Figure 17 form as Duct Section C, ATTENUATION.
Chapter 5–HVAC System Sound Analysis St = 60 x 63 Hz x 2.3 ft. ÷ 1,250 = 7.0 K = - 27 St = 60 x 125 Hz x 2.3ft. ÷ 1,250 = 13.8, K = - 34 St = 60 x 250 Hz x 2.3ft. ÷ 1,250 = 27.6, K = - 42 St = 60 x 500 Hz x 2.3ft. ÷ 1,250 = 55.2, K = - 51 St = 60 x 1000 Hz x 2.3 ft. ÷ 1,250 = 110.4, K = - 60 St = 60 x 2000 Hz x 2.3 ft. ÷ 1,250 = 220.8, K = - 72 St = 60 x 4000 Hz x 2.3 ft. ÷ 1,250 = 441.6, K = - 90* St = 60 x 8000 Hz x 2.3 ft. ÷ 1,250 = 883.
Introduction to HVAC System Sound Analysis Next, we need to come up with the attenuation that Junction D will provide. When a takeoff occurs on a main duct, the available sound energy must divide between the resulting duct runs after the takeoff. As a result, neither duct at the point where it leaves a junction can have all of the sound power level energy that was available at that point.
Chapter 5–HVAC System Sound Analysis Junction F Since the takeoff at Junction F has the same physical dimensions and airflow velocity as the takeoff at Junction D, calculating the GNL is identical to that previously done for Junction D, and the same GNL values apply. Therefore, the same values are entered into the HVAC system - sound analysis form (Figure 17) as Junction F GNL entries.
Introduction to HVAC System Sound Analysis Duct Takeoff/Junction H Following the procedure given for Junction and Takeoff Airflow Noise in Chapter 3, HVAC Sound Sources, the basic formula is: JLw = K + 10 Log F + 50 Log UB + 10 Log S + 10 Log D – JC Where: Elw = the net sound power level increase (or decrease if it is negative). K = a factor dependent upon design conditions. F = the octave band center frequency in Hz. UB = the branch duct airflow velocity. 12 in. Diameter = 0.79 sq ft 1,200 cfm ÷ 0.
Chapter 5–HVAC System Sound Analysis JC = -107 + Δr + ΔT Δr = Junction Radius/Branch Duct Diameter Since there is no radius at the junction: Δr = 0.0 and r ÷ DBR = 0.0 ΔT is a turbulence factor that doesn’t apply since there is no element within five duct diameters upstream of Junction H. Therefore: JC = -107 + 0.0 + 0.0 = -107 The following chart summarizes the terms and results of the JLw formula to determine the GNL of Junction H at each octave band.
Introduction to HVAC System Sound Analysis Therefore: JC = -107 + 0.0 + 0.0 = -107 The following chart summarizes the terms and results of the JLw formula to determine the GNL of Junction H at each octave band.
Chapter 5–HVAC System Sound Analysis Duct Section I Duct Diameter = 12 inches With reference to Table 16, the following attenuation applies per foot of duct length: 63 125 250 500 1,000 2,000 4,000 8,000 Hz Hz Hz Hz Hz Hz Hz Hz 0.03 dB 0.03 dB 0.03 dB 0.05 dB 0.07 dB 0.07 dB 0.07 dB 0.08 dB Multiplying these values by the 8 feet yields the following attenuation in each octave band: 63 125 250 500 1,000 2,000 4,000 8,000 Hz Hz Hz Hz Hz Hz Hz Hz 0.2 dB 0.2 dB 0.
Introduction to HVAC System Sound Analysis St = 60 x 1000 Hz x 1.0 ft ÷ 1,528 = 39.3, K = -53 St = 60 x 2,000 Hz x 1.0 ft ÷ 1,528 = 78.5, K = -63 St = 60 x 4,000 Hz x 1.0 ft ÷ 1,528 = 157.1, K = -74 St = 60 x 8,000 Hz x 1.0 ft ÷ 1,528 = 314.1, K = -95* *Estimated Value The chart below sums up the factors comprising the ELw values for each octave band.
Chapter 5–HVAC System Sound Analysis Reheat Terminal The reheat terminal GNL values are obtained from the manufacturer and are restated in the chart below. (Note also that in this example, the short duct section after elbow J and before the Reheat Terminal is considered to have a negligible effect on the discharge sound and is therefore not evaluated.
Introduction to HVAC System Sound Analysis Perforated Diffuser The perforated diffuser GNL NC rating is listed as NC 35 by the manufacturer and are expanded in the chart below based on the values from Table 12 and are then entered into Figure 17.
Chapter 5–HVAC System Sound Analysis = 1.44 f = octave band frequency Hz. N = number of ceiling diffusers = 2. RLp = 27.6 Log (10) + 5 Log (1.4) + 3 Log (Hz) -1.3 Log (2) – 30 = 27.6 +0.7+ 3 Log (Hz) -0.4 – 30 = 3 log (Hz) -2.1 Substituting each octave band frequency in the Hz term will yield the following room dB attenuation values at each octave band: 63 125 250 500 1,000 2,000 4,000 8,000 Hz Hz Hz Hz Hz Hz Hz Hz 3.3 dB 4.2 dB 5.1 dB 6.0 dB 6.9 dB 7.8 dB 8.7 dB 9.
Introduction to HVAC System Sound Analysis HVAC system -sound analysis Analysis By: Noise Associates Inc. Date: 8/15/95 System/Room Identity: Supply System to Room 101 Notes: Sheet 1 of 2 Figure 17. Example of an HVAC System Sound Analysis – Page 1 of 2. Siemens Building Technologies, Inc.
Chapter 5–HVAC System Sound Analysis HVAC system -sound analysis Analysis By: Noise Associates Inc. Date: 8/15/95 System/Room Identity: Supply System to Room 101 Notes: Sheet 2 of 2 Figure 17. Example of an HVAC System Sound Analysis – Page 2 of 2. 86 Siemens Building Technologies, Inc.
Introduction to HVAC System Sound Analysis Figure 18. Room 101 Sound Pressure Level Curve. As Figure 18 illustrates, the sound pressure level in the room, due to the supply system, is acceptable for a laboratory (NC 45), and except for the relatively moderate amount of lower frequency sound in the 125 to 500 Hz range, would even be acceptable in an office.
Chapter 5–HVAC System Sound Analysis Commentary on HVAC System Sound Based upon the preceding example of a sound analysis for an HVAC supply system to a room, we can form these general observations regarding HVAC system sound sources and attenuation: • The major source of sound in a system is typically the supply fan. In this example, it has a peak sound power level of 100.5 dB at 250 Hz.
Commentary on HVAC System Sound Laboratory Room Ambient Sound Aside from the sound caused by the supply system serving a laboratory room, the major source of a chemical laboratory’s HVAC ambient sound is often due to the exhaust side of the ventilation system particularly chemical fume hood exhaust. As a result, a laboratory room sound analysis should also address the exhaust side of the ventilation system.
Chapter 5–HVAC System Sound Analysis When a fume hood sash is open, exhaust terminal discharge sound will emanate from the fume hood opening and be the major source of ventilation sound heard by the fume hood user. In this case, the discharge sound level rating provided by the exhaust terminal manufacturer (at various airflows) should be reviewed for acceptability.
Commentary on HVAC System Sound Exhaust Terminal Reverberant Radiated Sound Power Level at 50% Maximum Airflow 125 250 500 1,000 2,000 4,000 Hz Hz Hz Hz Hz Hz 47 dB 41 dB 36 dB 32 dB 28 dB 23 dB Exhaust Terminal Reverberant Discharge Sound Power Level at 50% Maximum Airflow 125 250 500 1,000 2,000 4,000 Hz Hz Hz Hz Hz Hz 61 dB 56 dB 53 dB 49 dB 45 dB 39 dB NOTE: Exhaust terminal manufacturer’s sound ratings typically cover only the 125 to 4,000 Hz octave bands.
Chapter 5–HVAC System Sound Analysis To determine the attenuation and subsequently the sound power level a person would experience standing mid way between the two terminals (about a 7 foot distance from the person’s ears to each point in the ceiling just below the terminals), the Space Effect (Schultz) equation is used: RLp = 5 Log (V) + 10 Log (r) - 25 + 3 Log (f) Where: RLp = Attenuation due to distance and room size. V = Room Volume (240 sq ft x 10 ft). R = Distance from the sound source (7 ft).
Commentary on HVAC System Sound Discharge Sound Since the terminals are 8 inches in diameter and will be horizontal, we can assume that there will be one 90 degree radius type of elbow and some modest length of unlined round duct between each of the exhaust terminals and the fume hood. With respect to an 8 inch diameter 90 degree radius type of elbow, there will be some small amount of sound power generated as 450 cfm of air (1,290 fpm) passes through it, and there will also be some attenuation.
Chapter 5–HVAC System Sound Analysis Terminal Radiated Sound -Example Analysis 2 If it is decided to locate the two exhaust terminals, from the previous example, directly atop the fume hoods (approximately seven feet above the floor in the laboratory), you should ask yourself the following questions: • What sound pressure level would a person then experience when standing at the front of a fume hood with the sash 50% open? • Would the new sound pressure level experienced by a person at the fume hood be
Chapter 6–Minimizing HVAC Sound Chapter 6 offers general guidance as a convenient summation on minimizing excessive or objectionable HVAC sound.
Chapter 6–Minimizing HVAC Sound • Anticipate potential noise problems when difficult situations or configurations leave no choice but to depart from good design practice. • Consider utilizing additional sound isolating equipment enclosures and additional sound absorbing elements. • Rooms without a dropped ceiling and exposed ductwork are especially prone to radiated sound from terminal units, and other duct elements.
Duct Configurations • When designing an HVAC system, never try to specify the resulting sound pressure level of a HVAC system component. Instead, specify the required sound pressure level (room NC or RC) to be attained in the space(s) served and where in the room the measurement should be taken. • When considering a specific fan for a particular application, always obtain the manufacturer’s certified sound rating at the standard rating condition of 1 cfm and 1.00 in. WC.
Chapter 6–Minimizing HVAC Sound • Terminals should be mounted as high above the room’s ceiling as practical. At least three feet above a dropped ceiling should be maintained whenever possible. • Lined metal duct between a supply terminal and the air diffusers will best attenuate the air terminal unit sound and allow the least sound breakout. Purposely locating terminals to use longer runs to diffusers will enable more attenuation of terminal sound.
Terminal Equipment Noise Problem Potential Remedy Excessive Room Supply Air Diffuser Sound • This is usually a higher pitched whistling sound caused by a high pressure drop across air diffusers. (Ensure the problem is the diffuser by removing it and noting if a substantial reduction in the sound level occurs.) Ensure that the flexible duct at the connection to the diffusers is in relatively good vertical alignment.
Chapter 6–Minimizing HVAC Sound Sound Attenuation Devices It is often necessary to add sound attenuation devices when it is determined that a sound level cannot be adequately attenuated by the duct system itself or the HVAC system configuration. Noise attenuation devices are divided into two categories; active and passive.
Sound Attenuation Devices A sound trap is typically larger in external dimensions than the duct it is intended to be used with, since it must incorporate internal sound absorbing material and baffles. Therefore, it can require an angular duct transition piece at the inlet and outlet of the silencer. The transition element should not utilize angles greater than 15 degrees when connecting to fan outlet ducts. Duct silencers come in many configurations and lengths and their pressure drops vary.
Chapter 6–Minimizing HVAC Sound The principle of the attenuation system is rather straightforward. The source input microphone is located in the area where the offensive sound is present. The control unit creates a near mirror image output signal of the sound sensed by the input microphone, but 180 degrees out of phase with the sound waves of the offensive sound.
Sound Measurement Instrumentation Sound Measurement Instrumentation Whenever the sound level becomes an issue, it must be measured and quantified before it can be resolved. Handheld battery operated sound level meters are available. These typically have a tube-shaped microphone that protrudes out of the top of the unit and a meter or display of the sound level at the selected octave band. Meters vary as to features with the more sophisticated ones offering a digital display of sound dB levels.
Appendix This Appendix contains blank copies of certain graphs and forms that have appeared in this document. They are intended to be copied and used for sound measurement and analysis. It includes the following topics: • NC and RC Curves, Tabular Listing • NC Curve • RC Curve • Sound Analysis Worksheet • Sound Measurement Worksheet NC and RC Curves, Tabular Listing NC Curves vs.
Appendix RC Curves vs. Sound Pressure Level Decibels Tabular Listing RC 31.5 63 125 250 500 1,000 2,000 4,000 CURVE Hz Hz Hz Hz Hz Hz Hz Hz 25 – 45 40 35 30 25 20 15 30 55 50 45 40 35 30 25 20 35 60 55 50 45 40 35 30 25 40 65 60 55 50 45 40 35 30 45 70 65 60 55 50 45 40 35 50 75 70 65 60 55 50 45 40 NC Curve Noise Criterion (NC) Curve 106 Siemens Building Technologies, Inc.
RC Curve RC Curve Room Criterion (RC) Curve Siemens Building Technologies, Inc.
Appendix Sound Analysis Worksheet HVAC system -sound analysis Sheet of Analysis By: Date: System/Room Identity: Notes: ______________________________________________________________ Example HVAC System Sound Analysis Worksheet. 108 Siemens Building Technologies, Inc.
Sound Measurement Worksheet Sound Measurement Worksheet Example HVAC System Sound Measurement Worksheet. Siemens Building Technologies, Inc.
Appendix 110 Siemens Building Technologies, Inc.
Glossary This glossary describes various terms and acronyms used in this application guide. For a comprehensive listing of building control terminology, see the Technical Glossary of Building Controls Terminology and Acronyms (125-2185). A-Weighted Sound Level A single number in dB that represents the effect of all frequencies of a given sound on the human ear.
Glossary attenuate, attenuation To decrease the sound power level resulting in a lower sound pressure level at the point of concern. Also see insertion loss. background sound Sound from sources other than the one being measured or analyzed. In a room being analyzed for HVAC sound, background sound may typically include cooling fans on electronic equipment, copy machines, conversation, and even outside sources such as traffic, etc.
Sound Measurement Worksheet frequency When applied to sound, it’s the number of complete pressure wave fluctuations per second. The measurement unit is cycles per second called Hertz (Hz). Human hearing allows us the hear sound within the range of about 20 Hz to 20,000 Hz. insertion loss The reduction in sound power level due to the physical ability of something to absorb or dissipate sound power. Also see attenuation.
Glossary sound pressure level The pressure (dB) on a unit area caused by a sound source some distance away. Sound pressure is therefore only the effect of a portion of the total sound power output of a sound source, much like the force of the air on a given area of tissue paper is only a small portion of the total output power of a fan.
Index A Active Sound Attenuation Devices, 103 Air Delivery Device Sound, 43 A-Weighted Sound Level, 16 B Background Sound, 2 Basic System Design Criteria, 97 Blade Frequency Increment, 24 C Calculate Damper Blockage Factor BF, 31 Calculate Pressure Loss Coefficient C, 31 Calculate the Velocity Factor U, 31 Ceiling and Wall Absorbers, 103 Commentary on HVAC System Sound, 88 Computer Program Sound Analysis, 3 D Damper Airflow Noise, 30 Decibels, 9 Determining an RC Rating, 20 Discharge Sound, 93 Discharge Sou
Index Laboratory Elements, 45 Laboratory Room Ambient Sound, 89 Laboratory Room Sound Analysis, 88 Linings, 102 N NC and RC Curves, Tabular Listing, 107 NC Curve, 108 NC Curves, 17 O Octave Bands, 13 Organization of Guide, I P Passive Sound Attenuation Devices, 102 Perforated Diffuser, 83 Plenums, 48 Purpose of this Guide, I R Radiated Sound, 91 Radiated Sound Attenuation, 66 RC Curve, 109 RC Curves, 18 Rectangular Acoustically Lined Sheet Metal Ducts, 54 Rectangular Unlined Sheet Metal Ducts, 51 Rectangul
Siemens Building Technologies Inc. 1000 Deerfield Parkway Buffalo Grove, IL. 60089-4513 1-847-215-1000 125-1929 Copyright © 2009 Siemens Building Technologies, Inc. Country of Origin: US www.sbt.siemens.