
Basic Documentation
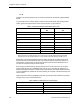
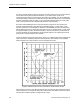
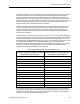
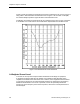
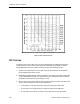
Table Of Contents
- About this Application Guide
- Chapter 1–Introduction
- Chapter 2–Physics of Sound
- Chapter 3–HVAC Sound Sources
- Chapter 4–HVAC Sound Attenuation
- Introduction to HVAC Sound Attenuation
- Plenums
- Duct Attenuation
- Duct Takeoffs and Divisions
- Duct Silencers
- End Reflection
- Environment Adjustment Factor
- Space Effect
- Radiated Sound Attenuation
- Chapter 5–HVAC System Sound Analysis
- Chapter 6–Minimizing HVAC Sound
- Appendix
- Glossary
- Index

Sound Measurement Parameters
Note that a solid line curve in the lower left portion of the graph is labeled as the approximate
threshold of a hearing curve. This represents the dB sound pressure level that must be
present in a person’s eardrum in order for the person to hear a particular sound frequency.
Recall that in Table 1, the threshold for hearing is listed as 0 dB sound pressure level. With
reference to Figure 3, this really applies to sound frequencies above 4,000 Hz that are in the
area of the high pitched beep of a computer speaker. At the lower frequencies, the sound
pressure level must be considerable higher to be audible.
The sound pressure level of a particular sound such as a fan running, a transformer hum, or
car horn can be measured with a sound level meter at a specific distance from the sound.
The sound pressure in dB at each frequency band can be plotted on the graph and the
resulting curve will show the profile of the sound similar to the dotted line and dashed line
curves shown in Figure 3.
The dotted line curve is a predominantly lower frequency curve since it has a high dB level in
the lower frequency bands and a lower dB level in the higher frequency bands. This sound is
characterized as rumbly or somewhat like a drumming sound. The dashed line curve is just
the opposite and is characterized as a hissy type sound or somewhat like an air leak. In order
for a sound to be acceptable for sound masking (white noise) or as an acceptable
background, it must be fairly well balanced across the audible sound spectrum. Since neither
of these two sound curves are well balanced, they would not be acceptable for sound
masking and instead would probably be very annoying.
Table 3. Adding Sound Pressure or Sound Power Levels.
Difference between the highest and
lowest dB of multiple sounds at a specific
octave band center frequency
Add this dB to the highest dB of the
sounds to obtain the resultant dB at the
octave band’s center frequency
0 3.0
1 2.6
2 2.1
3 1.8
4 1.5
5 1.2
6 1.0
7 0.8
8 0.6
9 0.5
10 0.4
12 0.3
14 0.2
16 0.1
For example, in Figure 3 at the 500 Hz frequency, one sound pressure level is at 24 dB and
another at 50 dB. The difference between them is 26 dB. With reference to Table 3, this is
well beyond the 16 dB difference. As a result, 0 dB is added to the higher one (50 dB) that
results in no change to the total sound pressure level.
Siemens Building Technologies, Inc. 15