
Basic Documentation
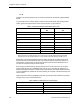
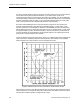
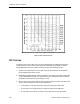
Table Of Contents
- About this Application Guide
- Chapter 1–Introduction
- Chapter 2–Physics of Sound
- Chapter 3–HVAC Sound Sources
- Chapter 4–HVAC Sound Attenuation
- Introduction to HVAC Sound Attenuation
- Plenums
- Duct Attenuation
- Duct Takeoffs and Divisions
- Duct Silencers
- End Reflection
- Environment Adjustment Factor
- Space Effect
- Radiated Sound Attenuation
- Chapter 5–HVAC System Sound Analysis
- Chapter 6–Minimizing HVAC Sound
- Appendix
- Glossary
- Index

Chapter 2–Physics of Sound
Figure 4 shows the resulting sound pressure level when combining the two curves of Figure 3
using Table 3. Note that where the individual curves of Figure 1 are more than 16 dB apart,
the resultant always equals the higher dB value of the individual curves.
Incidentally, the resulting sound produced by the combined sound curve of Figure 4 would be
a combination of a rumble and hiss and would still be objectionable as an ambient sound.
Figure 4. Two Sound Pressure Levels Combined.
A-Weighted Sound Level
In an effort to come up with a simpler method to address sound ratings for equipment,
A-weighted sound levels that also use decibels, are sometimes used particularly when
compliance with OSHA noise limits is the issue. However, the A-weighted criterion is limited
to only being a reference of the overall loudness and does not represent the full frequency
distribution characteristics of a sound. In particular, it does not specifically indicate the
presence of the low frequency level sound component, which is the most important area of
sound analysis.
16 Siemens Building Technologies, Inc.