
Basic Documentation
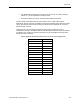
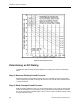


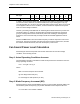

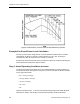
Table Of Contents
- About this Application Guide
- Chapter 1–Introduction
- Chapter 2–Physics of Sound
- Chapter 3–HVAC Sound Sources
- Chapter 4–HVAC Sound Attenuation
- Introduction to HVAC Sound Attenuation
- Plenums
- Duct Attenuation
- Duct Takeoffs and Divisions
- Duct Silencers
- End Reflection
- Environment Adjustment Factor
- Space Effect
- Radiated Sound Attenuation
- Chapter 5–HVAC System Sound Analysis
- Chapter 6–Minimizing HVAC Sound
- Appendix
- Glossary
- Index

Determining an RC Rating
Step 3. Plot Curve of Octave Band
Plot an actual curve of all of the octave band frequencies obtained in Step 2 on the graph,
and compare this curve with the reference curve drawn in Step 2.
• If the actual curve does not depart from the reference curve throughout all octave
bands by more than 5 dB, the actual curve is considered to be neutral. The suffix N is
added to the value obtained in Step 1.
• If the actual curve is above the reference curve by more than 5 dB at any octave
frequency less than 500 Hz, the actual sound is considered to be rumbly. The suffix
R is added to the value obtained in Step 1.
• If the actual curve is above the reference curve by more than 3 dB at any octave
frequency greater than 500 Hz, the actual sound is considered to be hissy. The suffix
H is added to the value obtained in Step 1.
• If the actual sound has an identifiable predominant tone such as a clicking, whining,
whistle etc., the actual sound is considered to have a tonal character. The T suffix is
also added to the N, R, and H suffixes.
Example of RC Analysis
If an existing room has an actual measured sound profile as listed in the following chart, what
RC Criterion would apply?
The average dB at 500, 1,000, and 2,000 Hz is calculated as: (43 + 35 +30) / 3 = 36.
With respect to Figure 7, the RC reference curve is plotted as the dashed line and the actual
sound curve is plotted as a solid line. Note that the actual curve does not exceed the
reference curve by more than 5 dB below 500 Hz, nor more than 3 dB above 500 Hz. Thus,
the sound RC criterion for this particular room sound would be classified as neutral and is
summarized as: 36 (N).
Although this particular sound has a slight rumble as indicated by the rise above the
reference curve in the lower frequencies, it would still be very acceptable as an overall sound
level for applications requiring an RC 35 level.
Siemens Building Technologies, Inc. 21