
Basic Documentation
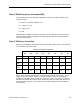
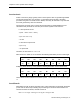
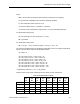
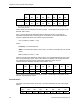
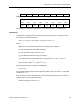
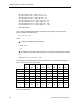
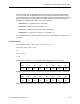
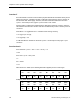
Table Of Contents
- About this Application Guide
- Chapter 1–Introduction
- Chapter 2–Physics of Sound
- Chapter 3–HVAC Sound Sources
- Chapter 4–HVAC Sound Attenuation
- Introduction to HVAC Sound Attenuation
- Plenums
- Duct Attenuation
- Duct Takeoffs and Divisions
- Duct Silencers
- End Reflection
- Environment Adjustment Factor
- Space Effect
- Radiated Sound Attenuation
- Chapter 5–HVAC System Sound Analysis
- Chapter 6–Minimizing HVAC Sound
- Appendix
- Glossary
- Index

Introduction to HVAC System Sound Analysis
dB dB dB dB dB dB dB dB
Multiplying these values by the 6 feet yields the following attenuation in each octave band:
63 125 250 500 1,000 2,000 4,000 8,000
Hz Hz Hz Hz Hz Hz Hz Hz
1.0
dB
0.7
dB
0.4
dB
0.3
dB
0.2
dB
0.1
dB
0.1
dB
0.1
dB
These values are entered into the Figure 17 form as Duct Section C, ATTENUATION.
Junction D
Following the procedure given for Junction and Takeoff Airflow Noise in Chapter 3, HVAC
Sound Sources, the basic formula is:
JLw = K + 10 Log F + 50 Log UB + 10 Log S +10 Log D – JC
Where:
Elw = the net sound power level increase (or decrease if it is negative).
K = a factor dependent upon design conditions.
F = the octave band center frequency in Hz.
U
B
= the branch duct airflow velocity (1,250 fpm).
S = the branch duct cross sectional area in square feet (16 in. x 36 in. ÷ 144) = 4.
D for Junctions = (4S/π)
0.5
ft = (4x4/π)
0.5
ft = 2.3.
Determining the K values requires first calculating M.
M = U
M
÷ U
B.
Since all ducts leaving the junction have the same airflow velocity, U
M
and U
B
= 1,250 FPM.
Therefore, M = 1.0.
Next, the Strouhal number is determined for each octave band center frequency. Then the
graph in Figure 13 will provide the K values.
Strouhal number (St) = 60 F D ÷ U
B
Siemens Building Technologies, Inc. 73