
Basic Documentation
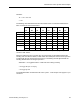
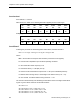
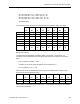
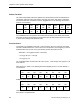
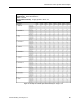
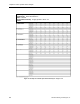
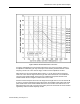
Table Of Contents
- About this Application Guide
- Chapter 1–Introduction
- Chapter 2–Physics of Sound
- Chapter 3–HVAC Sound Sources
- Chapter 4–HVAC Sound Attenuation
- Introduction to HVAC Sound Attenuation
- Plenums
- Duct Attenuation
- Duct Takeoffs and Divisions
- Duct Silencers
- End Reflection
- Environment Adjustment Factor
- Space Effect
- Radiated Sound Attenuation
- Chapter 5–HVAC System Sound Analysis
- Chapter 6–Minimizing HVAC Sound
- Appendix
- Glossary
- Index

Introduction to HVAC System Sound Analysis
Figure 18. Room 101 Sound Pressure Level Curve.
As Figure 18 illustrates, the sound pressure level in the room, due to the supply system, is
acceptable for a laboratory (NC 45), and except for the relatively moderate amount of lower
frequency sound in the 125 to 500 Hz range, would even be acceptable in an office.
With reference to the sound analysis data in Figure 17, we can see that the sound power
level in the 125 to 500 Hz range continues to go down until it reaches the 74 to 69 dB level
just prior to the reheat terminal. At this point, the combined sound power with that of the
reheat terminal results in a slight increase to about 76 to 70 dB.
Note that if the sound power level in this Hz range were brought down to no more than 60 dB
by using 1-inch lined ductwork throughout the system, the resultant sound power level at that
point would remain at the reheat terminal GNL level of 70 to 62 dB. This reduction of 6 to 8
dB would result in the room curve lying more closely to the NC 30 and NC 35 curves and also
significantly reduce the lower frequency rumble.
Siemens Building Technologies, Inc. 87