
Basic Documentation
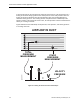

Table Of Contents

Summary of Pressure Components
Table 4 lists velocity pressures and the corresponding airflow velocities for the typical range
of ventilation airflows.
Table 4. Velocity Pressure vs. Airflow Velocity
21
Velocity Pressure Airflow Velocity Velocity Pressure Airflow Velocity
Inches
W. C.
Pascals Feet per
Minute
Meters
per
Second
Inches
W. C.
Pascals Feet per
Minute
Meters
per
Second
0.0050 1.2444 283 1.439 0.1300 32.3489 1444 7.336
0.0100 2.4884 401 2.035 0.1400 34.8373 1499 7.613
0.0150 3.7326 491 2.492 0.1500 37.3257 1551 7.880
0.0200 4.9768 566 2.877 0.1600 39.8141 1602 8.138
0.0250 6.2210 633 3.217 0.1700 42.3024 1651 8.389
0.0300 7.4651 694 3.524 0.1800 44.7908 1699 8.632
0.0350 8.7093 749 3.806 0.1900 47.2793 746 8.868
0.0400 9.9535 801 4.069 0.2000 49.7676 1791 9.099
0.0450 11.1977 850 4.316 0.2500 62.2095 2003 10.17
0.0500 12.4119 896 4.549 0.3000 74.6514 2194 11.14
0.0600 14.9303 981 4.984 0.3500 87.0933 2369 12.04
0.0700 17.4187 1060 5.383 0.4000 99.5352 2533 12.87
0.0800 19.9070 1133 5.755 0.4500 111.9770 2687 13.65
0.0900 22.3954 1202 6.104 0.5000 124.4190 2832 14.39
0.1000 24.8838 1266 6.434 0.5500 136.8610 2970 15.09
0.1100 27.3722 1328 6.748 0.6000 149.3030 3102 15.76
0.1200 29.8605 1387 7.049
21
Data applies to standard air at. 29.92 Inches of Mercury (Hg) and 70
0
F which equals 0.0750 lbs./ft
3
(101.32 kPa & 21.1
0
C =
1.20 kg/m
3
)
Siemens Building Technologies, Inc. 49