
Application

Sequence of Operation
Venturi Table Evaluation and Editing (Mode 1, 3)
22
Siemens Industry, Inc.
BACnet LCM-OAVS, Application 6760
140-1326
2015-07-07
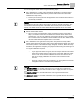
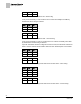
During calibration, voltage/flow values are automatically generated. Typically there are
8 or 9 pairs. The first pair of voltage/flow values—the low flow point—is not generated;
it must be set manually. The Venturi Valve actuator is then fed the voltages and the
application reads the resulting airflows. At the end of calibration, the airflow readings
are analyzed and the calibration is either given a PASS or a FAIL (GEX VLV STAT is
set to CAL OK or NOTCAL). To obtain a CAL OK, the airflow readings must increment
correctly (the points in the table increase as the voltage increases). For example, if one
point on the voltage/flow curve shows 5V and 500 cfm and the next point shows 6V
and 450 cfm, the second point (6V, 450 cfm) would fail. But 6V at 550 cfm would pass.
(This example assumes the actuator is direct acting, where more volts equal more
flow. Exhaust devices are usually reverse acting and have an inverse voltage/flow
relationship.) Too many failed airflow points along the voltage/flow curve will result in a
NOTCAL status for the calibration.
This application has a table statement edit feature that allows you to view and edit the
voltage/flow values in the table. This is useful for fine tuning the air valve to meet
precise room flow setpoints and for diagnosing/editing problematic voltage/flow curves
(see the Table
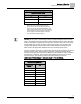
Venturi Air Valve Table Statement
).
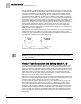
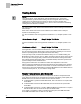
Problematic Venturi Air Valve Voltage/Flow Curves.
NOTE:
Bouncy flow means that airflow through the air valve’s flow orifice is too turbulent to
be read consistently.
Venturi Table Evaluation and Editing (Mode 1, 3)
A Venturi Air Valve table statement consists of two sets of voltage/flow values—one
set is active and the other inactive. When you run the calibration, the first thing that
happens is that the inactive table values are filled in with new values generated by the
calibration. Then the application checks these new values to make sure they are good.
If they pass (that is, if enough increment correctly), these new values become the
active values, and the old active values become inactive. However, if the new values
don’t pass, then the old active values remain active.
Running a successful calibration sequence is one way of changing/updating the active
values. You can also edit the table manually. Normally this is not necessary, but if you
are having flow control problems you may need to edit the table.
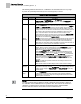
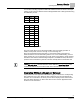
In order to manually edit the table statement, you must first know which points in the
active table need adjusting. This is done by setting V TABLE PT
to the appropriate
active point values found in the Table
Venturi Air Valve Table Statement
in order to
gather and view the active voltage/flow curve for the Venturi Air Valve and its actuator.
By gathering and analyzing the active voltage/flow values (for example, you can plot
them on a graph as in the figure
Problematic Venturi Air Valve Voltage/Flow Curves
),
you can decide which one(s) need adjusting. The flow curve should be smooth and
incremental.