
Basic Documentation
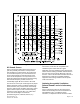

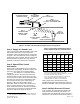

Table Of Contents
- Getting a Handle on Decibels
- The Frequency Component
- The Octave Bands
- Sound Curves
- Now Come the Complications and Confusion
- NC Sound Curves
- Attaining Acceptable Ventilation Related Sound Levels in Laboratory Rooms
- Equipment Sound Ratings
- Fume Hood Sound
- Attaining an Acceptable Room Sound Level
- Example Analysis of a VAV Research Laboratory Room Supply Air System
- Item 1: Supply Air Sound Level
- Item 2: Space Effect Sound Attenuation
- Item 3: Multiple Sources of Sound
- Item 4: Allowable Supply Air Sound at Diffusers
- Item 5: End Reflection Sound Attenuation at Supply Diffuser Inlet
- Item 6: Supply Air Terminal Duct Attenuation
- Item 7: Duct Division
- Item 8: Allowable Supply Terminal Discharge Sound
- Allowable Room Sound Level
- Room General Exhaust Terminal
- VAV Fume Hoods
- Suggestions for Reducing Excess Room Related Ventilation System Sound
- Conclusion

Figure 1. Noise Criterion (NC) Sound Curves.
NC Sound Curves
Figure 1 shows the familiar NC sound curves that
you have probably seen before. Sound pressure
level (loudness) is represented on the vertical axis
as 0 to 90 dB. Frequency is on the horizontal axis
and is represented by the standard octave band
center or mid frequencies. The very bottom curve
shows the approximate threshold of human hearing.
Note that low frequency sounds must be at a
considerably higher dB level in order to be heard.
The eleven NC curves (NC 15 through NC 65) depict
different loudness levels of ventilation related room
sound; therefore, they can be used to conveniently
specify a desired room ventilation sound level. Some
types of rooms require a lower sound level (library,
conference rooms, private office, etc.) while other
rooms can tolerate higher sound levels
(manufacturing areas, cafeteria, kitchen, etc.).
For instance, if NC 35 is the acceptable room
ventilation system sound level for a given
application, then the ventilation system design must
ensure that the resulting ventilation related sound in
the room does not exceed the dB levels of the NC
35 curve. Later in this document we'll discuss how to
determine the maximum acceptable ventilation
equipment sound ratings needed to meet specific
room sound criteria.
Attaining Acceptable Ventilation
Related Sound Levels in Laboratory
Rooms
First, it is important to bear in mind that trying to
achieve unnecessarily low room sound levels can
add additional cost to a ventilation system.
Therefore, it is important to know the client’s needs
Siemens Industry, Inc.
Page 3 of 12
Document No. 1
49-979