
Basic Documentation
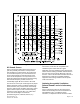

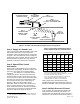
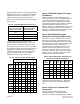

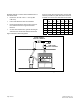
Table Of Contents
- Getting a Handle on Decibels
- The Frequency Component
- The Octave Bands
- Sound Curves
- Now Come the Complications and Confusion
- NC Sound Curves
- Attaining Acceptable Ventilation Related Sound Levels in Laboratory Rooms
- Equipment Sound Ratings
- Fume Hood Sound
- Attaining an Acceptable Room Sound Level
- Example Analysis of a VAV Research Laboratory Room Supply Air System
- Item 1: Supply Air Sound Level
- Item 2: Space Effect Sound Attenuation
- Item 3: Multiple Sources of Sound
- Item 4: Allowable Supply Air Sound at Diffusers
- Item 5: End Reflection Sound Attenuation at Supply Diffuser Inlet
- Item 6: Supply Air Terminal Duct Attenuation
- Item 7: Duct Division
- Item 8: Allowable Supply Terminal Discharge Sound
- Allowable Room Sound Level
- Room General Exhaust Terminal
- VAV Fume Hoods
- Suggestions for Reducing Excess Room Related Ventilation System Sound
- Conclusion

combined sound level that is 3 dB greater than their
individual sound levels. To determine the allowable
individual sound level for the diffusers, you must
subtract 3 dB from the combined sound level.
Table 4 gives the resulting sound levels for multiple
sou
nd sources.
Table 4. Combining Multiple Sound Sources.
Difference between the
highest and lowest dB in
a specific octave band.
Add this to the
highest dB to obtain
the resultant dB.
0 to 1 3
2 to 4 2
5 to 8 1
9 or more 0
Page 8 of 12
Siemens Industry, Inc.
Levels in Table 4 are from ASHRAE 2001
Fundamentals Handbook, Chapter 7, Sound and
Vibration; Table 3 Combining Two Sound Levels.
The resulting sound levels for item 3 now establish
the maximum allowable sound level ratings at each
supply diffuser. If a manufacturer provides their
equipment sound ratings in terms of an NC curve
number, Table 5 provides the corresponding
individual dB
levels for each octave band.
Table 5. Sound Level dB’s for NC Curves.
Octave Band
1 2 3 4 5 6 7 8
NC
CURVE
63
Hz
125
Hz
250
Hz
500
Hz
1000
Hz
2000
Hz
4000
Hz
8000
Hz
15
47 36 29 22 17 14 12 11
20
51 40 33 26 22 20 17 16
25
54 45 38 31 27 24 22 21
30
57 48 42 35 31 30 28 27
35
60 53 46 40 36 34 33 32
40
64 57 51 45 41 39 38 37
45
67 60 54 49 46 44 43 42
50
71 64 59 54 51 49 48 47
55
74 67 62 58 56 54 53 52
60
77 71 67 63 61 59 58 57
65
80 75 71 68 66 64 63 62
Item 4: Allowable Supply Air Sound
at Diffusers
When the supply air terminal discharge sound
reaches the diffusers it must not significantly add to
the maximum allowable air diffuser sound level.
Table 4 indicates that a 5 dB difference in sound
level would n
ot add more than, perhaps, 1 dB to the
maximum allowable air sound level at the air
diffusers. Therefore, 5 dB will be subtracted from the
maximum allowable sound level at the diffusers to
become the maximum allowable supply air terminal
discharge sound allowed at the diffusers.
Item 5: End Reflection Sound
Attenuation at Supply Diffuser Inlet
When a duct connects to a diffuser inlet, some low
frequency sound energy is reflected back into the
duct. This Duct End Reflection results in the sound
attenuation listed in Table 6. The sound attenuation
levels re
sulting from duct end reflection are
dependent upon the diameter of the duct. In this
example assume a duct diameter of 12 inches,
which is a normal inlet diameter for an air diffuser
that handles 1000 cfm. These dB values are then
added to the Item 4 allowable supply air terminal
discharge sound level at the diffusers.
Table 6. Duct End Reflection Attenuation for
Various Connecting Duct Diameters.
Dia.
(Inches)
125
Hz
250
Hz
500
Hz
1000
Hz
2000
Hz
4000
Hz
6 14 9 5 2 1 0
8 12 7 3 1 0 0
10 11 6 2 1 0 0
12 9 5 1 1 0 0
16 7 3 1 0 0 0
20 6 2 1 0 0 0
Levels in Table 6 are from ASHRAE 2003
Applications Handbook, Chapter 47 - Sound and
Vibration Control, Table 19 Duct End Reflection
Loss.
Item 6: Supply Air Terminal Duct
Attenuation
Lined ductwork provides excellent sound
attenuation. However, using fiberglass-lined
ductwork is no longer widely applied due to health
Document No. 1
49-979