
Basic Documentation
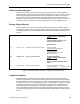
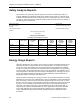
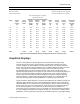
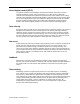
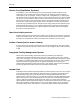
Table Of Contents
- About this Application Guide
- Chapter 1–Introduction
- Chapter 2–Goals of the Laboratory Environment
- Chapter 3–Unique Ventilation Needs of a Laboratory Facility
- Chapter 4–Ventilation Systems Classification
- Chapter 5–Laboratory Facility Exhaust Systems
- Chapter 6–Laboratory Containment Units - Ventilation
- Chapter 7–Room Ventilation, Makeup Air, and Pressurization Control Systems
- Chapter 8–Laboratory Temperature and Humidity Control Systems
- Chapter 9–Laboratory Emergencies - Ventilation System Response
- Chapter 10–Laboratory Ventilation System - Validation
- Chapter 11–Laboratory Ventilation System - Commissioning
- Glossary
- Index

Chapter 10–Laboratory Ventilation System - Validation
Safety Analysis Reports
These reports can cover many areas of safety that are related to a laboratory facility. An
example applicable to a laboratory facility with a number of fume hoods, is a periodic report
of all fume hoods that have had face velocity alarms over a particular period. In the example
of Figure 21, each fume hood in a particular room that has had a low face velocity alarm in a
preceding month is summarized.
Run Date: 05/ 01/99 Report Period:
Run Time: 10:22:32 Start Date: 4/01/99 Start Time:
00:00:00
Kaemar Pharmaceutical End Date: 4/30/99 End Time:
00:00:00
Fume Hood Alarm Time Report
Room #060
Sorted By Fume Hood Number
Time Shown As Hours:Minutes:Seconds
Hood Number Face Velocity
Alarm Time
Emergency
Purge Mode
Time
General Failure
Mode Time
Alarm Time
During
Occupied
Period
Alarm Time
During
Unoccupied
Period
Alarm Time
During
Weekend
Period
FH 061 00:08:33 00:07:02 00:28:33 00:08:33 00:00:00 00:00:00
FH 062 00:12:47 00:00:00 00:00:00 00:00:00 00:12:47 00:00:00
FH 063 00:07:10 00:08:30 00:04:56 00:07:10 00:00:00 00:00:00
FH 064 00:46:13 00:00:00 00:00:00 00:00:00 00:46:13 00:46:13
FH 065 00:05:54 00:12:48 00:05:54 00:05:54 00:00:00 00:00:00
Figure 21. Fume Hood Alarm Time Summary Printout for a Laboratory Room.
Energy Usage Reports
Laboratory facilities are very intensive users of energy. However, substantial savings can be
attained if you make an effort to eliminate excess energy usage. To restrain unnecessary
energy use, energy consumption must be accurately known. Since laboratories nominally
receive 10 or more times the amount of conditioned air that is appropriate for a typical office,
it makes sense to keep track of laboratory room energy consumption. This enables room-to-
room comparisons to determine excessive energy consumption rates. Knowing each room's
energy consumption enables focusing efforts on those laboratory rooms that indicate an
appreciably higher than average consumption rate.
Figure 22 shows a laboratory room energy cost report for one month’s operation. The report
apportions the cost of the room ventilation due to the air consumption of each individual fume
hood. For instance, fume hood C-04 incurred the largest energy cost for the week, a total of
$310.67. This cost consists of the fan power necessary to supply and exhaust the fume hood
air and the cost to condition the fume hood makeup air prior to it being exhausted by the
fume hood. The month’s total energy cost is $1,845.90 as shown on the bottom right. By
comparing such reports for different laboratory rooms, higher than normal fume hood and
room energy utilization rates can be determined. Having this data, a facilitywide plan to
reduce and subsequently maintain the lowest possible energy consumption rate can be
formulated.
90 Siemens Building Technologies, Inc.