
Basic Documentation
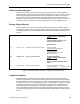
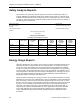
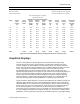
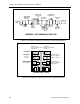

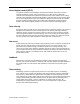
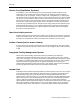
Table Of Contents
- About this Application Guide
- Chapter 1–Introduction
- Chapter 2–Goals of the Laboratory Environment
- Chapter 3–Unique Ventilation Needs of a Laboratory Facility
- Chapter 4–Ventilation Systems Classification
- Chapter 5–Laboratory Facility Exhaust Systems
- Chapter 6–Laboratory Containment Units - Ventilation
- Chapter 7–Room Ventilation, Makeup Air, and Pressurization Control Systems
- Chapter 8–Laboratory Temperature and Humidity Control Systems
- Chapter 9–Laboratory Emergencies - Ventilation System Response
- Chapter 10–Laboratory Ventilation System - Validation
- Chapter 11–Laboratory Ventilation System - Commissioning
- Glossary
- Index

Graphical Displays
Run Date: 05/01/99 Report Period:
Run Time: 10:45:05 Start Date: 4/01/99 Start Time: 00:00:00
Kaemar Pharmaceutical End Date: 4/30/99 End Time: 00:00:00
Fume Hood Energy And Cost Report
Research Section 610
Sorted By Average Fume Hood Opening
Hood# Average
Hood
Opening
(%)
Hood
Capacity
(CFM)
Exhaust
System
Energy
(KWH)
Exhaust
System
Cost
($)
Supply
Fan
Energy
(KWH)
Supply
Fan
Cost
($)
Primary
Cooling
Cost
($)
Primary
Heating
Cost
($)
Total Energy
Cost For
Operating
Hood
($)
C-04 82 1250 1285 64.25 2056 102.80 17.09 126.53 310.67
C-05 61 1250 964 48.19 1542 77.10 12.82 94.90 233.01
C-07 57 1250 890 44.50 1440 72.00 12.07 89.32 217.89
B-24 48 800 570 28.05 1280 64.00 10.67 78.96 181.68
C-10 34 1250 660 33.00 1056 52.80 8.80 65.12 159.72
C-02 31 1250 634 31.70 1015 50.75 8.46 62.60 153.51
B-22 30 800 458 22.90 739 36.95 6.16 45.58 111.59
C-05 30 800 458 22.90 739 36.95 6.16 45.58 111.59
B-23 29 1250 604 30.20 967 48.35 8.06 59.65 146.26
B-25 27 1250 588 29.40 941 47.05 7.84 58.02 142.31
C-06 21 1250 322 16.06 514 25.70 4.28 31.63 77.67
Totals 12,400 7433 371.15 12,289 614.45 102.41 757.89 1845.90
Figure 22. Fume Hood Monthly Energy Cost Report Printout for a Laboratory Area.
Graphical Displays
The use of color displays to dynamically portray technical information about facility
mechanical systems enhances the effectiveness of facility-wide monitoring and control
systems. Graphics can show diagrams of actual HVAC systems, floor layouts, individual
rooms, and even specific units of equipment such as individual biological cabinets and fume
hoods. The graphics are available for call-up by the system user and may also be
automatically linked to the alarm monitoring function. Thus, when an alarm occurs, the
appropriate graphic depiction of the system or room involved can be automatically displayed.
This can be particularly helpful in handling an alarm situation. Under normal conditions,
graphics with current operating information displayed are helpful for analyzing operating
system performance, training new facility personnel and acting as a communications aid
when demonstrating facility monitoring capabilities to regulatory agency personnel.
Figure 23 shows a graphic depiction of a primary air handling unit (Air Handling Unit 5W) in a
laboratory facility with specific control and monitoring points indicated. Figure 24 shows an
individual laboratory room (Laboratory CB 12) along with the specific control and monitoring
points for the room. The point values shown on these diagrams are continually updated so
that the displayed graphic is an excellent way to check on the actual conditions of a
mechanical system or a laboratory room. To call attention to off-normal operating conditions,
the values displayed (temperatures, humidities, airflows, etc.) are shown in a flashing mode.
Additionally, a hard copy printout is also typically available on request for any graphic display.
Siemens Building Technologies, Inc. 91