
Basic Documentation
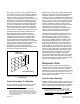
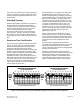
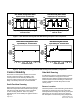
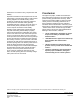
Table Of Contents

Since the ASHRAE 11
0 response time test states
that the test begins with the sash at 25% of the
maximum design opening, the starting point for the
exhaust airflow is 25% of 720 cfm or about 180 cfm.
Also since the ASHRAE 110 response time test
concludes when face velocity is within 10% of the
setpoint, the final exhaust airflow for the test is 90%
of 720 cfm or approximately 650 cfm. (For some
unexplained reason the side wall sensing based
control was not able to reduce the exhaust airflow
down to 180 cfm for the starting position and so the
starting point for the side wall sensing tests is
approximately 350 cfm.)
action at the very instant sash movement begins. As
a result, sa
sh position sensing provides fast control
response and thus the fastest possible fume hood
response time.
Side Wall Sensing
When the sash is being repositioned, the airflow at
the side wall sensor will change and enable the
controller to detect a need to increase or decrease
fume hood exhaust airflow. However, there is an
inherent time lag between the start of sash
movement and the response of the side wall (air
velocity) sensor. Therefore, the start of corrective
face velocity control action will be delayed by this
time lag and result in a slower fume hood response
time.
Figure 4 shows that the response time for sash
positio
n based control is very rapid and consistent
for both the sash opening and sash closing actions.
The fume hood exhaust airflow quickly assumes its
proper value and remains stable at each sash
position.
Response Time Test Results
The side wall sensing based control exhibits a
somewhat slower response time and in some cases
the change in sash position results in unstable
control of the fume hood exhaust for an appreciable
time after sash movement.
Figure 4 shows two graphs of fume hood response
time for the same fume ho
od under identical test
conditions, and outfitted with both sash position
sensing and side wall sensing face velocity
controllers. The tests each consisted of opening the
sash from a 25% closed position to the fully open
position. After 60 seconds, the sash was restored to
the initial 25% open position. Each test was
repeated three times. Fume hood exhaust airflow
was measured in response to the elapsed time. The
tests were conducted on a 4-foot fume hood that
requires an exhaust airflow of approximately 720
cfm in order to maintain a 100 fpm average face
velocity with a fully open sash.
Although no
specific response time values are
provided for these tests, it is apparent that the nearly
vertical rise and fall for the sash position based
sensing graph is indicative of substantially faster
fume hood control response and a faster return to
stable conditions after a change in sash position.
Side Wall Sensing Based Control
Face Velocity Setpoint @ 100 FPM
0
20
40
60
80
100
120
140
A1
AIRFLOW
VELOCITY
THROUGH
SASH
OPENING
FPM
E2E1D2A2 B2B1 C1 C2 D1
Actual measured face velocity @ 10 equally spaced open sash locations
(30 second measurement duration at each location)
Side Wall Sensing Based Control
Face Velocity Setpoint @ 100 FPM
0
20
40
60
80
100
120
140
A1
AIRFLOW
VELOCITY
THROUGH
SASH
OPENING
FPM
E2E1D2A2 B2B1 C1 C2 D1
Actual measured face velocity @ 10 equally spaced open sash locations
(30 second measurement duration at each location)
Sash Position Sensing Based Control
Face Velocity Setpoint @ 100 FPM
0
20
40
60
80
100
120
140
A1
AIRFLOW
VELOCITY
THROUGH
SASH
OPENING
FPM
E2E1D2A2 B2B1 C1 C2 D1
Actual measured face velocity @ 10 equally spaced open sash locations
(30 second measurement duration at each location)
Sash Position Sensing Based Control
Face Velocity Setpoint @ 100 FPM
0
20
40
60
80
100
120
140
A1
AIRFLOW
VELOCITY
THROUGH
SASH
OPENING
FPM
E2E1D2A2 B2B1 C1 C2 D1
Actual measured face velocity @ 10 equally spaced open sash locations
(30 second measurement duration at each location)
Figure 3. Sash Position Sensing and Side Wall Sensing–Face Velocity Control Comparison.
Siemens Industry, Inc. Page 5 of 8
Document No. 149-975