
Operating Instructions
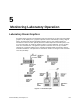

Laboratory Room Controller Owner's Manual
5-4 Siemens Building Technologies, Inc.
Maintaining Safety Records
ANSI Z9.5-1992 requires the designated cognizant person to maintain the permanent records
of each laboratory ventilation system.
The quantity of air that moves through the room is a basic indicator of safety because it
relates directly to the concentrations of air contaminants that develop. Sometimes this
indicator is stated in terms of an air change rate. In the LRC, the point TOTL SUPPLY
indicates the ventilation rate. (Some hygienists define the air change rate in terms of the
exhaust flow. In that case, the point TOTL EXHAUST serves the purpose). Most users should
have alarms on this value (refer to
Types of Alarms
in Chapter 3
, Controlling Laboratory
Airflow
) for the purpose of quickly correcting emergencies. It is also worthwhile to keep track
of this value over the long term. Collecting trend data on TOTL SUPPLY or hourly averages
of the point makes it possible to track ventilation. Through APOGEE, this data can be
automatically gathered, processed and archived to establish that the ventilation system has
continued to function correctly, and to observe any unfavorable events or trends.
In a room controlled by an LRC, the points VOL DIFFRNC and VOL DIF ALM are also safety
indicators. VOL DIFFRNC is the difference between the total exhaust airflow and the total
supply airflow to the room. This flow difference draws air currents from surrounding spaces
into the laboratory. The infiltrating airflow keeps contaminated laboratory air from spreading
throughout the building. APOGEE can be used to keep track of this value day in and day out,
making it possible for you to verify that the ventilation system works as designed to protect
people outside the laboratory. This continuous monitoring complements the periodic
inspections that verify that air moves in the right directions. The VOL DIFFRNCE data is
calculated from several airflow measurements. As such, the value may fluctuate
considerably. Sometimes the VOL DIF ALM point is a more appropriate indicator of safe
pressurization because it gives a steadier picture of the situation. Often it is preferable to
keep track of the alarm point instead of the flow difference.
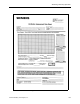
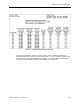
Figure 5-3 is an example of a laboratory pressurization report generated by APOGEE. This
report indicates the limits chosen to indicate safe pressurization and then shows if the room
spent any time outside the limits during the report period. There are many ways to apply the
APOGEE to generate this report, or one customized to your needs for records. Reporting can
be done remotely on-line or locally using the BAS. Your local Siemens Building Technologies,
Inc. office is qualified to describe your options and set up a safety reporting system that fits
your organization.