
Data Sheet for Product

3/12
Siemens Duct air quality sensors QPM11.., QPM21.. CE1N1962en
Smart Infrastructure 2020-03-03
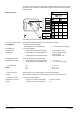
Mode of operation
The Symaro
TM
air quality sensors acquire the CO
2
concentration by infrared absorption
measurement (NDIR).
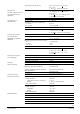
The resulting output signal of DC 0...10 V or DC 0...5 V or 4...20 mA is proportional to
the CO
2
content of the ambient air.
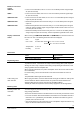
X1
CO
2
[ppm]
10
8
6
4
2
0
0
400
800
1
200
1
600
2
000
1961D01_0
1
[mA] [V]
20
16.8
13.6
10.4
7.2
4
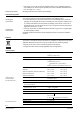
Symaro
TM
air quality sensors determine the mixed gas concentration (VOC) using met-
al-oxide semiconductor sensing elements. The sensors measure precisely at all times
and with no maintenance and recalibration required thanks to an integrated compensa-
tion mechanism, saving service costs.
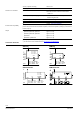
The sensor provides a DC 0...10 V or DC 0...5 V or 4...20 mA output signal proportion-
ate to the VOC content of the ambient air.
X1
% VOC
10
8
6
4
2
0
0
20
40
50
80
1
00
1961D03_0
1
[mA] [V]
20
16.8
13.6
10.4
7.2
4
Select the time constant for VOC measurement by limiting the maximum slew rate for
the VOC signal. The jumper X130 (measuring range) fine tunes the time constant for
VOC ventilation demand.
The center position (R2) produces a normal slew rate of max. 10% change to the VOC
signal per minute (factory setting). The other 2 position reduce (R1, 2.5% VOC/min) or
increase (R3, 40% VOC/min) the maximum slew rate. A smaller slew rate (R1) filters
out short-term VOC concentration peaks, e.g. caused by a highly perfumed person
passing by. The sensor reacts immediately and quickly to changes in VOC concentra-
tion at the higher slew rate (R3).
Time constant t
63
selected by jumper X130 corresponds to <13 min (R1), <3.5 min (R2),
or <1 min (R3) for a sudden change to 50% VOC.
The sensor acquires and evaluates the CO
2
/ VOC concentration and transforms it to a
ventilation demand signal.
It represents the result of maximum selection of the CO
2
measuring signal and the fil-
tered VOC measuring signal. With maximum selection, the 2 demand signals are com-
pared and delivered as the common air quality demand.
The ventilation demand signal is delivered via output X2 as a DC 0…10 V or 0...5 V or
4...20 mA signal to be fed to the ventilation controller.
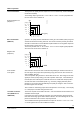
CO
2
concentrations
Function diagram CO
2
(output
X1
)
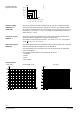
VOC concentration
(
QPM1100
)
Diagram VOC
(
Output
X1
)
Time constant
"VOC signal"
CO
2
/VOC concentra-
tion (QPM2102 and
QPM2102D
)