Navigator Start Guide Version SG001 Intern © Siemens AG 2017 siemens.
Content Chapter 1. Introduction ........................................................................................................................................ 3 Chapter 2. Supported Browsers ........................................................................................................................... 4 Chapter 3. How to Login ...................................................................................................................................... 5 Chapter 4.
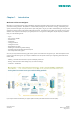
Chapter 1. Introduction Welcome to Siemens Navigator. Navigator is a cloud-based energy and sustainability management platform designed turning data into results across your entire building portfolio. The platform is customizable, allowing the user to achieve: en-ergy, sustainability, and system performance targets. The purpose of this quick start guide is to give you a basic understanding of concepts with regard to the usage of each of the Siemens Navigator functions.
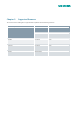
Chapter 2. Supported Browsers The current version of Navigator is supported and compatible with the following browsers.
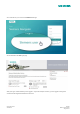
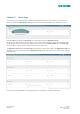
Chapter 3. How to Login Username and password are provided by your Advanced Service Centre (ASC). Go to: https://eadvantage.siemens.com/ The Navigator login page: As an external user you must use your Username and Password to login. You are directed to your landing page. If you forget your password click Forgot password and you are given directions as to what to do next.
As an internal user you must use the Siemens user login: You are directed to the CES login page After your login is authenticated you are logged in. If you have multiple accounts, you are logged in through the account with the highest authorized level of access.
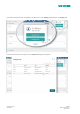
If you wish to change accounts immediately or at a later time click the Settings arrow and then click Change user. Click the account you wish to change to in the Change user dialog box that opens.
The Submit button is shown. Click Submit Your maximum login session is eight hours, however a session times-out after two hours of inactivity. Five minutes before the end of a session you get a reminder of the pending end of session. After eight hours you are automatically logged out and asked to re-authenticate. If your user account has the SMS authentication option enabled, you must enter a one-time password, in addition to the normal username and password.
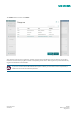
The one-time password/code is transmitted as an SMS to the mobile phone that is registered to the account. To log in click first log in and a one-time password (OTP) editor with an OTP ID is shown. Within a few minutes you receive an SMS with the OTP that corresponds to this ID. Type in the OTP received per SMS and click log in. When you are logged on, Navigator displays the ap-plications and functions that are allocated to you. To logout click Logout.
Chapter 4. Home Page On successful login your landing page by default is the lead application group in the favorites list as-signed to you. Here in our example the Monitoring & Control overview. The currently displayed favorite is underlined in white. Click the Home icon to display the Home Page. Your Home Page displays the Application Groups assigned to you. These are seen in the rows of tiles on your screen divided into groups set one above the other.
Chapter 5. UI description 5.1 Common toolbar legend: A: Common Toolbar Select the favorite to display in the Home Page, gain access to other controls. B: Home button Quick access to the Home Page showing all the dashboards available to you. Clicking this icon always returns you to the Home Page. C: Favorites Contains Application Groups or Apps, which are a collection of preconfigured applications allocated to you by your administrator.
5.2 Description of the Home Page work space The Home Page shows all the Application Groups that are available to you. If you click a tile or a favor-ite, this then replaces the Home Page. Click an App in the Sidebar of an App overview and this App is displayed in your workspace. You can search and filter Apps and you can bookmark any App as a favorite. The Apps are color coded for quick and easy search and recognition. The color of each App corresponds to its category.
In Navigator Apps, widgets are used to display information (for example, a tree structure or a report). The widgets can be positioned and resized to suit your own preferences. Point the cursor at the abutting widgets and a line appears. Drag the line in the desired direction to resize the widget. The App Sidebar displays the activation buttons for all the Apps contained in the App Group.
Chapter 6. Change settings You can make settings to your personal data in My Account, which is situated in the top right of the Common Toolbar. Click the username to open the My Account drop-down then click My Account to open the My Account dialog box. If you find discrepancies, you can correct the information and click Submit to save your changes. Click Reset to undo any changes that you have made in the immediate dialog box.
6.1 Other Settings 6.1.1 Setting a Favorite Application Group or App To set an Application Group as a Favorite, simply click the unfilled star above the Application Group. A solid star signifies that the Application is already a Favorite: You can also set an App as a Favorite.
6.2 Trash bin The Trash bin is the collection point for deleted meters. Meters that are deleted from the Trash bin are only then irrevocably deleted from the application. All deleted meters are recorded in the Trash bin table seen in the Trash dialog box.
6.
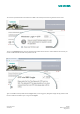
Chapter 7. Working with an Application Group 7.1 Create a New App Application Groups or App Groups are a specific feature of Navigator. Each App Group comes with a standard set of Apps but you can add your self-configured Apps to the App Groups. Click an App to open the dashboard, which is your work space. You can configure your personal Apps based on features assigned to your account, for example assigned reports. Step 1. To create a new App, click the Home button.
3. 4. 5. 6. Note: Apps that you create are owned by you and can be edited at any time by you. You cannot edit Apps that you do not own. Apps that you inherit are owned by their creators. Step 4. Click Save to confirm your settings.
7.2 Add an existing App to an App Group Add an existing App to an App Group as follows: Step 1. Click the Home button to open the Home Page Step 2. Select the required App Group for our example Efficiency Step 3. Click the Add App button The Create new app dialog box opens Step 4.
Step 5. Click Save to confirm 7.3 Search function Navigator offers the possibility to search for Apps, meter, nodes and tagged entries using the Search editor in the top right of the main window. The search engine searches the currently displayed view. Thus, for example a search started in the Home Page considers App Group names, App names and tags. In the Home Page, as you write the search function returns findings that correspond to your entries.
Click the X search cancellation button and the view returns the Home Page It is important to tag all newly created or assigned Apps as this greatly facilitates the search function.
Another search example in the Asset tree: The search is performed hierarchically from the search starting point, which is indicated by a check mark Quick Start Guide 23/10/2017 Siemens Building Technologies Page 23 of 51
Search findings are displayed in a detailed table that provides information that is more individual with regard to your search parameters. You are able to carry out a search across an entire client. 7.4 Filter function You can filter by different options to simplify a search for a particular App: Select the option Filter by Categories and the categories control buttons are shown.
Clicking the Category option opens an accordion of buttons allowing you to choose from the different App categories. The accordion of buttons is filtered according to their categories and color-coded for easy recognition. Clicking the Favorites option gives you a list of all Apps and Application Groups that you assigned as Favorites in the Common Toolbar.
7.5 Widgets & views 7.5.1 Linking widgets It is good practice to make one Reporting widget the primary widget by linking your other widgets to it and setting up through this one widget thus all adjustments made to this widget is automatically carried out in the connected widgets, for example the resolution period set in the primary widget is automatically followed by all the widgets connected to it. Click the Reporting widget's Settings icon followed by the Communications button.
The Node selection changes to indicate the node to which it is linked. Click the close settings icon Reporting widget view to return to the Point the cursor at the Communications button and a list of nodes linked to is shown. In our example the site map 7.5.2 Saving an App • Save your changes to an App by clicking the Save App button • Select Save view as The Save view as text editor opens: • Type a self-explanatory name into the text editor View name • Click Save to confirm.
7.5.3 Renaming your App To save an App that you have customized click Save app as Type a self-explanatory name for your App into the App name editor starting with a # tag and click save. 7.5.4 Add widgets to your App When you have created an App in your Dashboard, the App is of course empty and must be populated with widgets.
The widget control bar appears. Click the widget you want in your App workspace, for example the Navigation tree widget. This Widget tree opens imme-diately to full size in the work space.
Add a second widget to your App by simply dragging the icon of the widget you want, for example the Reporting widget, to the approximate required position in the workspace. Once in the workspace the cursor changes thus while being dragged: When it arrives at a place where it can be dropped it changes thus: Now you can drop it in place. There are now two widgets in the App workspace.
To delete a widget click the Settings icon to open the widget controls. Click the Trash icon. 7.6 How to configure a widget: Once the selected widgets have been created and saved within the App, The widgets are now ready for configuration Following the steps to create the report will differ depending on the report you have selected. Click the Reporting widget's Report button (it looks like a magic wand): You are directed to the Settings – Reporting view.
Click the Node selection Tree to set the required report level within the Tree structure The Generate reports view opens. Select the report that you require from the drop-down list.
Under Select benchmark make your benchmark settings and click Generate report.
Chapter 8. Multi-Dimensions The multi-dimensional feature allows you to see the different Context node structures. Click on a differ-ent 'Dimension' and the current Context node structure is replaced in the view with a Context node structure based on the criteria of the dimension chosen. You can change the views according to the Context node structure that you want to see. Follow the steps below to select the dimension you wish to view: Step 1. Click the home button Step 2. Click the Assets App Step 3.
Chapter 9. Asset tree view vierarchy The Asset tree view contains all of your data points and allows you to navigate through your data in an organized fashion. Navigator has several different node types to visualize your data. The following is a display of the levels and their names: Customer: Highest level node context, which displays the name of your company or organization. Country: This node type is used as an additional node type for re-porting.
10.1 Report output formats: • HTML: The report is presented in a separate browser window, and is not downloadable. Optimized for quick, onscreen viewing. • PDF: Depending on browser settings, the report is presented in a separate browser window or of-fered for download. Graphics are displayed on separate pages. Optimized for printing and archiving. • CSV: The report is presented in a separate browser window, and can be downloaded and stored.
10.3 Understanding Consumption and Comparison Reports There are many report types available within Navigator. For the purpose of this document we will show the two basic report types Consumption Reports and Comparison Reports. 10.3.1 Consumption Reports Consumption reports aggregate/sum-up data below the object you have selected in Navigator’s Tree View. For example, if you select a Site and Sub-meters you sum up all Sub-meters within that site into a single report.
Example: Main consumption report (Consumption Overview Report US) First select an object in the tree that you would like to report on. The Generate reports option is shown on the right hand side. Find the Main consumption report. Click Generate reports. Mandatory settings are marked with an asterisk (*). Enter the Start date and End date using the calendar editor to select the report period. Set the Resolution i.e. the regularity of reading times with-in the generated report, daily, weekly, monthly, etc.
Example of generated report Main consumption Quick Start Guide 23/10/2017 Siemens Building Technologies Page 39 of 51
1. Headers - Shows Report Name, Start/End date, Resolution, and Node Level. 2. Overview and Media Tabs • Provides an overview of all media chosen for main consumption meters and shows all energy types converted to a measuring unit in order to stack consumption for the specific time period. • Performance Indicator Tab – Gives consumption per square foot (Square foot must be included within the property of the node). • Create PDF – The Create PDF button is at the top of all HTML reports.
Example: Portfolio Compare Report Begin by selecting a building pool in the tree that you would like to report on. Once selected, the Generate reports option is shown on the right. Click Generate reports. General report information re-quired for all report generation: Step 1. In the drop down menu select Portfolio Compare report. Step 2. Select Start and End date. Step 3. Select Meter type (This will take into consideration only these meters for this report). Step 4.
Step 5. Select KPI (Reference Area in ft2) Step 6. Click Next Step 7. Select the object type – refers to the comparison of the building pool node, the site node, the object node or the element node. Click next.
Step 8. Select filter type – If this is configured for your account you can filter specific building types for your report. You can pick and choose which buildings you want to see based on the filter that is applied to it. Filters must be set up in the site node for this selection. If you do not select any filters, all applicable buildings will appear in the report. Step 9. Click Finish.
1. Header – Displays report name, start/end date, resolution and node context. 2. Overview tab – Shows all energy types (electricity and heat totals) converted to a common unit of kBtu in order to stack consumption for the specific time period 3. Fuels, district heating tab – Only shows gas in units of MMBTU 4. Electricity tab – Only shows electricity in units of kWh, this report is run on the main meters so it gives a breakdown of on/off peak consumption 5. Water – here shown in gallons 6.
Chapter 11. Favorite and subscribed reports Favorite reports can be configured at the node or meter level. They allow the option of having a report sent directly to your mailbox at a defined period. Reports can be subscribed to in the form of hourly, daily, weekly, monthly, quarterly, half-yearly or annual e-mails. The reports are transmitted as PDF files for saving and printing, or in CSV format (ASCII) for further editing.
11.1 Favorite report options • Send to: Name of the person to whom the report should be sent by e-mail. Various people can be selected depending on the role of the user adding the report. • Meter type: Type of meter to be included in the report. • Creation interval: How often should the report be generated. • Period: For what amount of time should the report be created. • Resolution: How often should the report be created? • Start date: The date the first report should be generated.
• Content: 'Rolling' reports use today’s date in combination with the period. If the period of the report is less than the time from the start date, then the start date is taken as today’s date - period. When 'Fixed' is selected, the period is always from the start date. From 'Year to Date' the period is always from the 1st January of the current year • Send: Place a check mark here to send the report by email. • Output Format: Defines the format of the report.
12.1.1 Editing a meter reading: 1. If you want to edit one of the last three readings, click the corresponding pencil icon symbolizing Edit under options. If you want to edit an earlier reading, first click Show all readings, then click the corresponding edit icon. 2. You can edit the reading date and meter reading. Click OK to add the changed value to the list of readings for the particular meter. The system checks the entered meter reading for plausibility. If not, the system will present a message.
12.1.2 Deleting a meter reading: You can delete readings from meters for which you have access rights. To delete one of the last three readings: 1. Click the corresponding delete icon (X) under options. 2. The warning "Do you really want to delete this reading?" is presented. 3. Click OK to delete the reading, or Cancel to stop it being deleted. Entering Multiple Meter readings: In the Monitoring & Control App Group click the My Meters App • Meter List: Displays the name of and path to the selected node.
The first column shows the meter name and meter number (optional on entry). You can select an individual reading date for each meter: Click Option to the left of the date box in the new reading date column, and select a date, using the calendar icon. • The date defined under Reading date (see above) applies to all other meters. • The Last meter reading column shows the date and value of the last meter reading. • You can enter a new reading for each meter in the Meter reading column.
We are the preferred partner for energy-efficient, safe, and secure buildings and infrastructure. Siemens Switzerland Ltd Building Technologies Division International Headquarters Gubelstrasse 22 6301 Zug Switzerland Tel +41 41 724 24 24 The information in this document contains general descriptions of technical options available, which do not always have to be present in individual cases. The required features should therefore be specified in each individual case at the time of closing the contract.