
User Manual


Quick Start Guide Siemens
23/10/2017 Building Technologies
Page 44 of 51
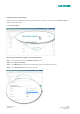
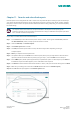
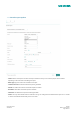
1. Header – Displays report name, start/end date, resolution and node context.
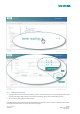
2. Overview tab – Shows all energy types (electricity and heat totals) converted to a common unit of kBtu in order to
stack consumption for the specific time period
3. Fuels, district heating tab – Only shows gas in units of MMBTU
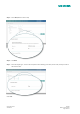
4. Electricity tab – Only shows electricity in units of kWh, this report is run on the main meters so it gives a
breakdown of on/off peak consumption
5. Water – here shown in gallons
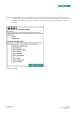
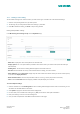
6. Performance indicator tab – Gives consumption per square foot. (square foot must be included within the
property of the node)
7. Create PDF – The Create pdf button is at the top of all HTML reports. This is useful for printing/emailing/sharing
with others
8. Sorting data – HTML reports are sortable by clicking the green column -headers