
Network Hardware User Manual

280 U3585-J-Z125-8-76
PCS report SM2 reports
PCS report
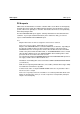
This report provides an overview of the activities of the Performance Control Subsystem.
Report output
The REPORT PCS statement is used to request the output of the PCS report.
The report can only be output if PCS was active during the last monitoring cycle.
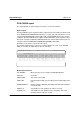
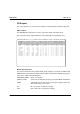
Monitoring information
This report contains the totals (SUM column) for all categories (except for the SQPLN and
RDACT values) in the first line below the table header. The data for the individual categories
(up to 16) is output in the following lines.
CATEGORY NAME Name of a category
SRACT (1/SEC) Service rate used by this category, specified as TOTAL, IO and CPU
TOTAL Total number of all service rates used by this category (sum of IO,
CPU and memory service rates)
IO IO service rates used by this category
CPU CPU service rates used by this category
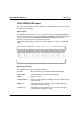
D016ZE04 SM2 PCS CYCLE: 120 S SAMPLES: 293 99-03-24 14:30:00
|CATEGORY | SRACT (1/SEC) | SQPLN | SQACT | RDACT | DUR-RO |DUR-RO-P|
| NAME | TOTAL | IO | CPU | (%) | (%) | |(1/SEC) |(1/SEC) |
+---------+-------+-------+-------+-------+-------+--------+--------+--------+
| SUM | 42739| 5765| 30845| | 100.0 | 1.0 | 0.657 | 0.000 |
| SYS | 5442| 1659| 3688| 0.0 | 12.7 | 1.0 | 0.000 | 0.000 |
| DIALOG | 57| 0| 57| 1.0 | 0.1 | 1.2 | 0.000 | 0.000 |
| BATCH | 520| 29| 472| 2.3 | 1.2 | 1.1 | 0.000 | 0.000 |
| TP | 447| 8| 392| 5.1 | 1.0 | 1.6 | 0.000 | 0.000 |
| TP1 | 63| 4| 55| 21.2 | 0.1 | 1.0 | 0.000 | 0.000 |
| BATCHDB | 0| 0| 0| 11.7 | 0.0 | ** | 0.000 | 0.000 |
| BATCHF | 818| 720| 94| 1.1 | 1.9 | 1.0 | 0.000 | 0.000 |
| DIALOG1 | 12227| 2352| 7888| 20.7 | 28.6 | 1.0 | 0.491 | 0.000 |
| DIALOG2 | 7002| 564| 5395| 20.0 | 16.3 | 1.0 | 0.166 | 0.000 |
| DIALOG3 | 16163| 429| 12805| 16.4 | 37.8 | 1.1 | 0.000 | 0.000 |