
User Manual


CM2U8567E / 04.1999 VISONIK DCS Functions and System Messages VVS18 Siemens Building Technologies
2-94 Funktion ... Landis & Staefa Division
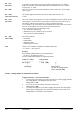
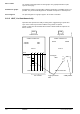
The software involved provides six-colour graphs. One graph printout takes up the
space of an A4 page.
Simultaneous output of several graphs to different terminals in a VISONIK Server is not
possible. They are automatically queued in VISONIK and output in a called sequence.
The processing time for a graph is approx. 30 seconds to 5 minutes.
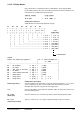
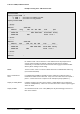
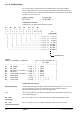
2.12.3 LDAT, List Data Numerically
Operation LDAT provides the facility for listing values, logged during a specific time
span. These values may be listed in tabular or long format as required.
Output of values from the the DPP,LDAT function is identical with the output for the
DPO,LI function.
( )
( )
( )
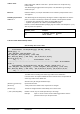
LFRM
08:00
1
2345
,,,NEV,,,0
08:00
$4'020
1.$4'020
2.$4'021
.
.
9370Z04E
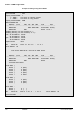
TFRM
Tabular format Long format
START of DATA-LIST START of DATA-LIST
from..to from..to
Time
30-Aug-90 30-Aug-90
END of DATA-LIST
max. 5 Series
Logged parameter
value
INST
INST
.
.
MEAN
END of DATA-LIST
Validity Marker
1st Series
Max. 6 colours
Simultaneous graphs
Processing time