
User Manual

CM2U8567E / 04.1999 VISONIK DCS Functions and System Messages VVS18 Siemens Building Technologies
2-112 Funktion ... Landis & Staefa Division
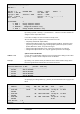
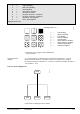
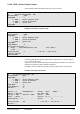
Symbol=*: ?
Character :
SPACE ! " $ % & ' ( ) * + , - . / @ : ; < = >
Capital Letters :
A B C D E F G H I J K L M N O P Q R S T U V W X Y Z
Numbers :
0 1 2 3 4 5 6 7 8 9
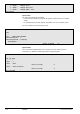
Symbol=*:
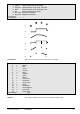
The list of dot patterns is the same as for Trend Plot:
Dot Pattern=0: ?
0 = (................)
1 = (. . . . . . . . )
2 = (........ )
3 = (.... .... )
4 = (.. .. .. .. )
5 = (.. .. )
6 = (.... .. .... .. )
7 = (.. . .. . )
8 = (. . . . )
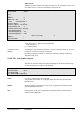
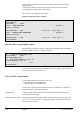
Dot Pattern=0: :
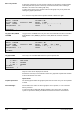
In any format the curves can be amplified or reduced in magnitude (Y-axis) by applying
a multiplication factor.
Mul. Factor=1: ?
Mul. Factor=(-1000..1000): 1
The displayed curve will be offset in the Y direction by the value given in "Offset"
Offset=0: ?
Offset=(-1E+30..1E+30): 0
Text (up to 16 characters)can be assigned to any curve. This then appears on output of
a DP Channel.
Text :
Test : Kitchen
Entry in graph : 1
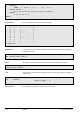
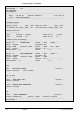
The following 'Area patterns' can be chosen for Bar charts:
Dot pattern=0
Mult.Factor=1
Offset
Text
Area pattern=0