
User Manual


CM2U8567E / 04.1999 VISONIK DCS Functions and System Messages VVS18 Siemens Building Technologies
2-120 Funktion ... Landis & Staefa Division
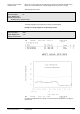
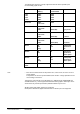
After the report start line a line is printed showing the relative graph number, date and
time.
A table then follows containing the DP channels which have been plotted in the graph.
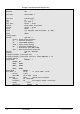
DPR 11:11:08 R E P O R T - S T A R T 18-Feb-90/So
(T8) T5
5: 18-Feb-90 11:11
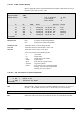
NAME PAR TYPE INT * Format SY Dot
----------------------------------------------------------------------------
3 A01'H1'MW"0401 ME INST I30m 1 Even * 0
4 A01'H1'MW"0401 ME INST I05m 1 Symbol . 0
^ ^ ^ ^
| | | |
| |
DP Channel multiplication factor Symbol |
|
Dot Pattern -----------------------------+
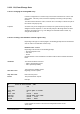
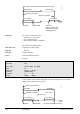
Graphic Presentation of Mean Values
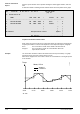
Mean values are formed at the end of a time interval but are valid for the whole interval.
Graphic presentation of a mean value depends on the output format (Even, Stepped).
Even: The mean value is shown in the middle of the time interval.
Stepped: The mean value is shown as a horizontal line above the
respective time interval.
The mean value at 08:00 is valid for the whole time interval (07:00..08:00). In a graph
with format "Even" the mean value is shown at 07:30.
With format "Stepped" the mean value is shown as a horizontal line covering the period
07:00 to 08:00.
11:0010:0009:0008:0007:0006:00
31.1.92
9370Z15E
Mean; I 60 m
Stepped
Linearised
Temp.
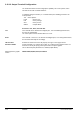
Notes on Associated
Report
Example