
Datenblatt

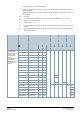
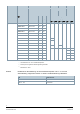
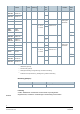
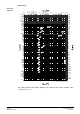
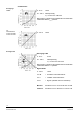
Table Of Contents

9
Siemens A6V11459527_de--
_k
Smart Infrastructure 2022-03-
04
Bemessung
Δp
max
Werte gelten für die Funktion „Mischen“, Δp
max
Werte für die Funktion „Verteilen“ siehe
Typenübersicht [▶ 2].
0,02
0,03
0,04
0,05
0,06
0,08
0,1
0,2
0,3
0,4
0,5
0,6
0,8
1
2
3
4
5
6
8
10
20
30
40
50
60
80
100
200
300
400
500
1
2
3
4
5
6
8
10
20
30
40
50
60
80
100
200
300
400
500
600
800
1000
2000
0,01
0,02
0,03
0,04
0,05
0,06
0,08
0,1
0,2
0,3
0,4
0,5
0,6
0,8
10
20
0,025
0,02
0,015
0,01
0,008
0,006
3000
600
800
1000
2000
3000
150
1500
1
2
3
4
5
6
1,5
8
15
30
k
V
S
0,04
0,06
0,03
0,05
0,08
0,1
0,15
0,2
0,25
0,4
0,6
0,3
0,5
0,8
1
1,5
2
2,5
4
6
3
5
8
10
15
20
25
40
60
30
50
80
100
150
200
250
400
600
300
500
800
3
1
.
5
2
0
1
2
.
5
8
5
3
.
2
2
0
.
8
0
.
5
0
.
3
2
0
.
2
1500
1
.
2
5
5
0
8
0
1
2
5
1
25
2
0
0
2
8
0
6
.
3
1
6
1
5
3
1
5
Durchfluss-
diagramm