
Laser Beam Analyzer OPERATOR'S MANUAL LBA-700/708/710/712/714PC
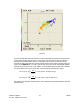
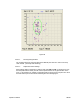

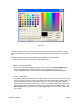
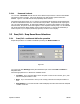
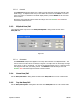

Figure 38
3.2.9.3.1 Zooming Histogram Plots
The zooming feature for histogram plots works basically the same as it does for the strip
chart window. (See Strip Chart Zooming)
3.2.9.3.2 Capture Resolution Settings.
When setting capture resolutions to settings other than Full and 1X, it is important to note
that the peak location scatter plot will not have peak locations on any pixel location in the
array. A 4X resolution for example, would have peaks occurring every forth pixel as a result
the Peak Scatter plot would look like something like the following figure:
Operator’s Manual LBA-PC
92