
Laser Beam Analyzer OPERATOR'S MANUAL LBA-700/708/710/712/714PC

3.2.9.3.4 Increment Bins and Reset
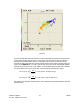
The centroid scatter-plot is also a histogram of the centroid location. The color bar between
the Peak and Centroid plots provides the user insight about centroid location/frequency.
Colors in the upper part of the bar indicate higher frequencies.
When running, the user will notice that blocks of data points have the same color. These
blocks of color represent the binning of the histogram. The program, based on the range of
data being presented, automatically defines the bin size.
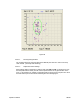
If the user desires to decrease the size of the bins, simply click the Inc Bins button and the
bins will be divided in half both vertically and horizontally creating 4 bins out of each existing
bin. Bin size will be decreased when the program collects the next data point, and previously
plotted points will be re-plotted with respect to the new bin size. If the Pointing Stability
program is paused, the change will not take place until the program is started and the next
data point is collected.
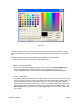
3.2.10 Create Palette…
Clicking on this option will cause a separate color palette generation application to be launched. This
application will allow the user to design their own custom beam display color palette. Spiricon has
included a sample set of palettes that you can use or alter as you wish.
Using this tool, the user can easily create their own palettes, or modify the standard palettes provided
with Spiricon products.
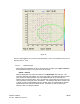
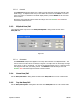
The Spiricon Palette Generation program ( c:\Spiricon\LBAPC\PALETTEGEN2.EXE ) is shown below.
This program is very easy to use once a few concepts are understood. This program can be launched
independently via the Windows Start button, or from within the LBAPC application as follows: From
the Options menu select Create Palette…, the following window will appear:
Operator’s Manual LBA-PC
94