
User manual


WHIRC Data Reduction Manual Version 2.0, 2014 June 26 40
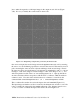
Figure 4.2: The pupil-corrected flattened data from the lower panel of Fig. 4.1, but
plotted as a function of time, in the order the data were obtained. The line is a
linear fit to the data and probably represents atmospheric extinction, since the
airmass increased over the span of the observations by approximately 0.20.