
Operating instructions


I [mA]
I 1
I 2
F1
F2
Fmax
0 20
P1
P2
B0088
Fig. 32
F1 Stroke rate at which the pump should operate with current I1
F2 Stroke rate at which the pump should operate with current I2
Plot a diagram similar to the one above - with values for (I1,
F1) and (I2, F2) – so that you can set the pump control as
required.
Using these processing types, you can control a metering pump using the
current signal as shown in the diagrams below.
Lower sideband:
The symbol
appears on the LCD screen. Below I1, the pump works at
a rate of F1 - above I2 it stops. Between I1 and I2 the stroke rate varies
between F1 and F2 in proportion to the signal current.
I [mA]
I 1 I 2
F2
F1
0 20
a) b)
P1
P2
Fmax
B0089
I [mA]
I 1
I 2
F1
0 20
P1
P2
F2
Fmax
Fig. 33: Lower sideband, e.g. alkali pump
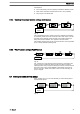
Upper sideband:
The symbol
appears on the LCD screen. Below I1, the pump is sta‐
tionary - above I2 the pump works at rate F2. Between I1 and I2 the stroke
rate varies between F1 and F2 in proportion to the signal current.
The smallest processable difference between I1 and I2 is 4 mA
I [mA]
I 1
I 2
F1
0 20
P1
P2
F2
Fmax
B0090
Fig. 34: Upper sideband, e.g. acid pump
Upper/lower sideband
Adjustment
42