
User`s guide


Si47xx-EVB
Rev. 0.8 105
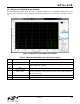
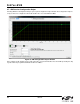
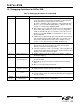
8.4. AM Receiver RSSI/SNR Graph Window
The RSSI/SNR graph window allows the user to plot RSSI and SNR across the AM band. Bitmap data can be
saved to file by selecting File
Save as Bitmap and tabulated data can be saved to file by selecting FileSave to
.csv.
Figure 81. AM Receiver RSSI/SNR Graph Window
Table 27. FM Receive RSSI/SNR Graph Window Descriptions
# Items Description
1 RSSI / SNR Graph
Select between drawing the RSSI or SNR graph.
2Line / Bar
Select between drawing in bar mode (depicted as green) or in continuous
line mode (depicted as yellow).
3Draw
Click this to start plotting the graph
4 Seek Threshold
(RSSI / SNR)
Draw the RSSI and/or SNR seek threshold as specified in the respective
properties. The RSSI seek threshold is shown in red; the SNR seek thresh-
old is shown in orange.
5 Mark Valid Stations
Mark Valid Stations based on the RSSI/SNR seek threshold settings.
6 Clear
Click this button to clear the traces selected in the Delete Plots combo box.
1
2
3
4
5
6