
User`s guide


Si47xx-EVB
94 Rev. 0.8
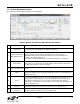
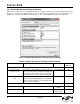
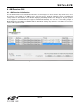
7.4. Weather Band Receiver RSSI/SNR Graph Window
The RSSI/SNR Graph Window allows the user to plot RSSI and SNR across the weather band. Bitmap data can be
saved to file by selecting File
Save as Bitmap and tabulated data can be saved to file by selecting FileSave to
.csv.
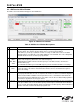
Figure 74. Weather Band Receiver RSSI/SNR Graph Window
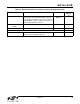
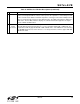
Table 24. Weather Band Receiver RSSI/SNR Graph Window Descriptions
# Items Description
1 RSSI/SNR Graph
Select between drawing the RSSI, SNR graph, or both.
2 Line/Bar
Select between drawing in bar mode or in continuous line mode.
3Draw
Click this to start plotting the graph.
4 Clear
Click this button to clear the entire graph.
1
2
3
4