
User guide
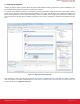
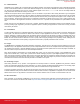
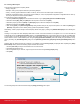

7.2 Logging Results
Simplicity
Network Analyzer can record software-based debug activity from the firmware on the embedded networking devices, allowing
application developers a glimpse into which firmware events correlate closely in time with certain network-related events and transac-
tions.
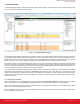
Stepping through a time-sensitive embedded networking application with a traditional debugger can disrupt the networking stack’s real-
time behavior, but with Network Analyzer, a firmware engineer can get a transcript of all networking stack API calls and stack callback
functions as they happen, which can be a big help in shedding light on why a certain network activity occurred or why it had a particular
outcome. Silicon Labs even provides a Virtual UART interface to allow for traditional printf output through Serial Wire debug lines to
enable application printf statements the stack API and callback activity.
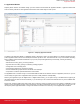
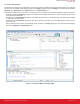
Other critical software activities, such as resets, assert() violations, and stack startup, are also captured in this [Events] listing, so de-
velopers have the maximum amount of information about what happened at runtime. This recorded information can also be sent to
Silicon Labs technical support to quickly resolve problems or answer questions.
7.3 More Information
More information on the Simplicity Network Analyzer tool can be found in "UG104: Testing and Debugging Ember Applications" in
Chapter 3. This document can be found on the Silicon Labs website: http://www.silabs.com/Support%20Documents/TechnicalDocs/
UG104.pdf.
AN0822: Simplicity Studio™ User Guide
Network Analyzer
silabs.com | Smart. Connected. Energy-friendly. Rev. 0.2 | 12