
User guide
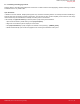
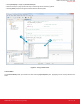
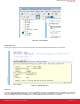
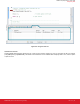
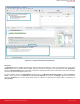
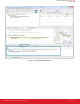
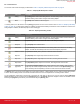
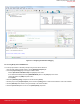

Figure 9.10. Using the Call Stack and Call Hierarchy
Snapshots
The [Snapshot]
feature is available while debugging saves the values of the registers on a device at a particular point in time. Take a
[Snapshot] when the core is halted and the register values are constant and accessible by the debug hardware. Each [Snapshot] is
listed in the [Snapshot Albums] view. This feature is useful when comparing the states of two systems next to each other or looking at
the state of the hardware at separate points in time.
To view a snapshot, switch to the [Development] perspective and go to [Window]>[Show View]>[Other] and select [Snapshot Al-
bums]. In the list, right click on a [Snapshot] and select [Launch Snapshot]. This will open the [Debug] perspective as it was at the
time of the [Snapshot], but it is not an active debug session on hardware. To switch back to a debug session on hardware, go to
[Run]>[Debug].
AN0822: Simplicity Studio™ User Guide
Simplicity IDE
silabs.com | Smart. Connected. Energy-friendly. Rev. 0.2 | 26