
User guide
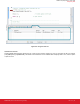

9.8 Common Actions
The common actions while developing are described in Table 9.1 Simplicity IDE Development Toolbar
on page 28.
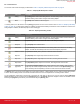
Table 9.1. Simplicity IDE Development Toolbar
Icon Command Description
Debug The [Debug]
button starts a new debug session. An active debug session must be disconnec-
ted before starting a new session using the same debug adapter.
Build The [Build] button builds the selected project.
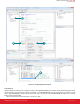
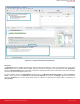
In a debug session, the IDE switches to the [Debug]
perspective with the common actions shown in Table 9.2 Simplicity IDE Debug
Toolbar on page 28. If a single debug adapter is available, the IDE will automatically download the code to the MCU. If more than one
debug adapter is available, the IDE will prompt to select a debugger.
Table 9.2. Simplicity IDE Debug Toolbar
Icon Command Description
Debug The [Debug]
button starts a new debug session. An active debug session must be disconnec-
ted before starting a new session using the same debug adapter.
Resume The [Resume] button runs the MCU after reset or after hitting a breakpoint.
Suspend The [Suspend] button halts the MCU.
Disconnect The [Disconnect] button terminates the current debug session and disconnects the debug
adapter. The IDE will automatically switch back to the Development perspective.
Reset the Device The [Reset the Device]
button performs a hardware reset on the MCU.
Step Into The [Step Into] button single steps into the first line of a function.
Step Over The [Step Over] button single steps over a function, executing the entire function.
Step Return The [Step Return]
button steps out of a function, executing the rest of the function.
Instruction Step-
ping Mode
The [Instruction Stepping Mode] button toggles assembly single stepping. When enabled,
single steps will execute a single assembly instruction at a time. See the
[Disassembly] view
for the assembly code corresponding to the source code at the current line of execution.
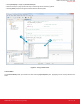
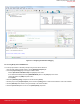
The [Debug]
view in the top-left corner displays any active debug sessions. A debug adapter can only support a single debug session
at a time. An active debug session must be disconnected before code can be recompiled and a new debug session started.
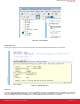
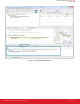
To set a breakpoint, double-click in the blue bar to the left of the code editor or right-click on a line of code and select [Add Break-
point]. Breakpoints can be managed using the [Breakpoints] view in the [Debug] perspective. Register contents are viewable and edit-
able using the [Registers] view. Memory can be accessed using the [Memory] view.
AN0822: Simplicity Studio™ User Guide
Simplicity IDE
silabs.com | Smart. Connected. Energy-friendly. Rev. 0.2 | 28