
Specifications
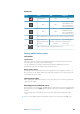
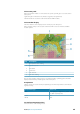

Color Shading
Sirius weather option.
You can define the sea surface temperature range and wave height color coding.
The temperature above warm and below cool values will be displayed as progressively
darker red and darker blue.
Waves higher than the maximum value will be indicated with progressively darker red.
Waves lower than the minimum value will not be color coded.
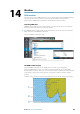
Marine zones
Enter a short description of your concept here (optional).
Sirius™ service includes access to weather reports for all U.S. Marine Zones, with the
exception of the high seas zones.
You can setup the system to read the forecast for a selected area.
Tap the selected zone, and use the menu to confirm your selection.
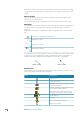
Tropical statements
Enter a short description of your concept here (optional).
You can read tropical statements including information about tropical weather conditions.
These statements are available for the entire Atlantic and the Eastern Pacific.
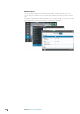
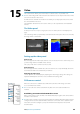
Showing Sirius weather details
When you tap a shaded weather area, available information will be shown in the cursor
window.
If pop-up is enabled, you can tap an weather icon to display the identity of the observation. If
you tap the pop-up detailed information about the observation is be displayed. You can also
display the detailed information from the menu when the icon is selected.
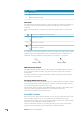
Animating Sirius™ weather graphics
The NSS evo2 records the weather information you have turned on, and this information can
be used to animate past or future weather conditions. The amount of information available
in the system depends on the amount of weather activity; the more complex it is, the less
time will be available for animation.
You can animate the past or the future, depending on which weather view you have turned
on:
• if the precipitation overlay was turned on, you can animate for the past and only assume
weather conditions in the immediate future.
• if the colored wave height overlay was turned on, you can animate the future (the
predictions).
When activated, the time for the current graphic animation will be displayed in the lower left
corner of the chart panel.
Weather| NSS evo2 Operator Manual
87