
User's Manual


Debugging Kernel and User Application uClinux NEEK BSP
#nios2-linux-uclibc-insight Helloworld.gdb
9. A source window will open and display the source Helloworld.c.
10. The open a gdb console, with View>Console, enter gdb command in this
window.
gdb>target remote 192.168.0.14:9999 (board_ip:9999)
11. Then it will report the target address of the program. Now you can set
break points and debug. On target you can see the message: Remote
debugging from host IP, here you will see your IP (IP of host) address.
gdb> b main (insert break point at main)
gdb> c (continue)
12. Now you can debug via command or through GUI of insight. Insight GUI
are quite easy to understand. If you want to use command then you can
use:
gdb> s (for single stepping)
gdb> r (to run program )
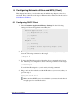
7.3 Debugging User application using Eclipse IDE
To debug the user application, follow the steps below.
1. Follow all steps mentioned in Ethernet driver selection, from chapter
Configuring Device Driver.
2. Build the uClinux kernel by selecting
3. Open the terminal. Change directory to the Eclipse IDE folder
4. Write the command on the terminal to open the Eclipse IDE.
#./eclipse
5. Type workspace to choose your workspace.
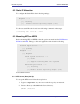
User application ---->
miscellaneous application ---->
[*] gdbserver(old).
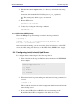
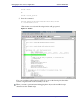
6. Select File>New>C project to Create a new project.
7. Enter Helloworld as your Project name.
42 System Level Solutions