
User's Manual


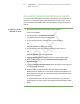
Table Of Contents
- Important information
- About SMART Response
- Installing SMART Response
- Getting started
- Using SMART Response
- About SMART Notebook
- Creating Assessments
- Adding questions to the assessment
- About question types
- About intelligent expression grading
- Adding questions using the Insert Question wizard
- Importing questions from a Word document
- Example Word document question formats
- Importing questions from an XML or SQZ file
- Importing questions from a PDF file
- Adding choices to a question
- Tagging questions
- Starting and connecting to a class
- Disconnecting students from a class
- Using clickers
- Completing assessments
- Reviewing, printing and exporting assessment results
- Maintaining SMART Response
- Hardware environmental compliance
- Waste Electrical and Electronic Equipment Regulations (WEEE directive)
- Restriction of Certain Hazardous Substances (RoHS directive)
- Batteries
- Packaging
- Covered Electronics Devices
- China’s Electronic Information Products regulations
- U.S. Consumer Product Safety Improvement Act
- California Air Resource Board – Airborne Toxic Control Measure
- Restriction of Certain Chemicals (REACH directive)
- Customer support

6 7
4. Click the Page Sorter tab, and then select a question.
5. Click the Response tab.
6. Click Results.
A summary of the class's responses to the question appears, including a chart
showing the number of responses to each possible answer.
N O T E
You can toggle the type of chart displayed by selecting Show bar chart or
Show pie chart.
T I P
You can insert the chart into the question page by clicking Insert chart
into Notebook.
7. Click Show beside Details.
A list showing each student's submitted response appears, including the time it
took them to respond.
N O T E S
o
Use discretion when displaying sensitive grade information to all
class members. If you started the class in Sign In mode, consider
clearing the Remember names check box before you start the
assessment to not display student names in the Response tab. (You
can later review, print and export the results in Teacher Tools.)
o
If you started the class in Anonymous mode or cleared the
Remember names check box before you start the assessment,
student names display as Anonymous-1, Anonymous-2, and so on.
| C H A P T E R 4 – U S I N G S M A R T R E S P O N S E