Draft 4/14/15- Do Not Distribute User Manual ZEEMS330A Rev.
Draft 4/14/15- Do Not Distribute Legal Information Trademarks Snap-on, ShopStream Connect, SureTrack, Fast-Track Troubleshooter, ProDemand, ShopKey Pro and VERUS are trademarks registered in the United States and other countries of Snap-on Incorporated. All other marks are trademarks or registered trademarks of their respective holders. The Bluetooth word mark and logos are registered trademarks owned by Bluetooth SIG, Inc. and any use of such marks by Snap-on Incorporated is under license.
Draft 4/14/15- Do Not Distribute Safety Information READ ALL INSTRUCTIONS For your own safety, the safety of others, and to prevent damage to the product and vehicles upon which it is used, it is important that all instructions and safety messages in this manual and the accompanying Important Safety Instructions manual be read and understood by all persons operating, or coming into contact with the product, before operating.
Draft 4/14/15- Do Not Distribute Safety Information Safety Signal Words Safety Signal Words All safety messages contain a safety signal word that indicates the level of the hazard. An icon, when present, gives a graphical description of the hazard. Safety Signal words are: '$1*(5 Indicates an imminently hazardous situation which, if not avoided, will result in death or serious injury to the operator or to bystanders.
Draft 4/14/15- Do Not Distribute Contents Safety Information ..................................................................................................................... iii Contents ....................................................................................................................................... i Chapter 1: Using This Manual ................................................................................................... 1 Conventions........................................
Draft 4/14/15- Do Not Distribute Contents Screen Messages ................................................................................................................ 26 Making Selections ................................................................................................................ 26 Scanner Screen Layout ....................................................................................................... 27 Menu Options..............................................................
Draft 4/14/15- Do Not Distribute Contents Operations .................................................................................................................................. 97 Starting the Scope and Multimeter....................................................................................... 97 Measurement Out of Range................................................................................................. 99 Scope and Multimeter Setup.................................................
Draft 4/14/15- Do Not Distribute Contents Common Replaced Parts Graph ........................................................................................ 151 Dashboard Feature Information ......................................................................................... 152 Starting SureTrack from the Home Screen .............................................................................. 154 Using the SureTrack Website..........................................................................
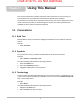
Draft 4/14/15- Do Not Distribute Chapter 1 Using This Manual This manual contains basic operating instructions and is structured in a manner to help you become familiar with your Diagnostic Tool features and perform basic operations. The illustrations in this manual are intended as reference only and may not depict actual screen results, information, functions or standard equipment. Contact your sales representative for availability of other functions and optional equipment. 1.1 Conventions 1.1.
Draft 4/14/15- Do Not Distribute Using This Manual Conventions 1.1.4 Notes and Important Messages The following messages are used. Note A note provides helpful information such as additional explanations, tips, and comments. Example: i NOTE: For additional information refer to... Important Important indicates a situation which, if not avoided, may result in damage to the test equipment or vehicle. Example: IMPORTANT: Disconnecting the USB cable during vehicle communication can cause damage to the ECM.
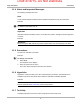
Draft 4/14/15- Do Not Distribute Chapter 2 Introduction This chapter introduces the basic features of the Diagnostic Tool, including the control buttons, data ports, battery pack, and power sources. Your Diagnostic Tool is a specialized personal automotive diagnostic solution that combines information with test instrumentation to help you diagnose symptoms, codes, and complaints quickly and efficiently.
Draft 4/14/15- Do Not Distribute Introduction Features and Specifications 9 9 0$; 1— Stylus Storage 2— Scope Module M4 (removable) 3— Camera Lens 4— Communication and Power Jacks Cover 5— Head Phone Jack 6— Micro uSD Card Slot 7— USB (universal serial bus) Jacks (2) 8— DC Power Supply Input Jack 9— Docking Station Connector 10—Battery Pack 11—Collapsible Stand Figure 2-2 4
Draft 4/14/15- Do Not Distribute Introduction Features and Specifications Technical Specifications Item Touch Screen Display Description / Specification Capacitive Touch Panel 10.1 inch diagonal, TFT Color LCD 1280 x 800 resolution (WXGA) Processor Intel Quad Core N2930, 1.8GHz Operating System Microsoft® Windows® Embedded 7 Communications Wi-Fi standard (802.11 b/g/n) Bluetooth® 2.1 Technology Rechargeable Lithium Ion Smart Battery Pack, 11.
Draft 4/14/15- Do Not Distribute Introduction Features and Specifications Built-in Stand The built-in stand extends from the back of the Diagnostic Tool to allow hands-free viewing. The stand clips into the Diagnostic Tool for storage and pivots out so the display is at a 45 degree angle when in use.
Draft 4/14/15- Do Not Distribute Introduction Features and Specifications 2.1.
Draft 4/14/15- Do Not Distribute Introduction Features and Specifications Remote Operation If needed, the Scope Module (M4) can be removed from the Diagnostic Tool, then connected to the Diagnostic Tool with a USB cable. This increases the range of mobility for the Diagnostic Tool while monitoring signals on the test vehicle. Use the Type A/B USB cable, which is provided with your kit, to make the connection. For additional information see, Using the Scope Module Remotely on page 84.
Draft 4/14/15- Do Not Distribute Introduction Features and Specifications 2.1.
Draft 4/14/15- Do Not Distribute Introduction Features and Specifications Wireless Communication The Scan Module is a wireless communications device that transmits vehicle data to the Diagnostic Tool without a physical connection. A signal lost due to moving out of range automatically restores itself when the Diagnostic Tool is brought closer to the Scan Module. The Scanner sounds a tone when the signal is lost. Technical Specifications Item Description / Specification Bluetooth® 2.
Draft 4/14/15- Do Not Distribute Basic Operation and Navigation Chapter 3 This chapter describes the basic operation, and navigation of the Diagnostic Tool. 3.1 Turning On/Off, Sleep Mode and Emergency Shutdown The following sections describe how to turn the Diagnostic Tool on and off, use Sleep Mode and perform an emergency shutdown. Before using the Diagnostic Tool, make sure the battery is fully charged or is connected to an AC/DC power supply. see Power Sources on page 6. 3.1.
Draft 4/14/15- Do Not Distribute Basic Operation and Navigation Turning On/Off, Sleep Mode and Emergency Shutdown 3.1.3 Sleep Mode The Windows operating system uses Sleep Mode to conserve power by stopping all processes and turning off the display screen, while keeping the diagnostic tool on and your open applications active. When you are ready to resume work, the diagnostic tool can be started up again quickly from the same screen it was on previous to going to sleep.
Draft 4/14/15- Do Not Distribute Basic Operation and Navigation Shortcut (S) Button 3.2 Shortcut (S) Button The shortcut (S) button (Figure 3-1) located on the front of the diagnostic tool, and is a customizable button that can be set to perform various routine functions. Figure 3-1 i NOTE: You can open the Shortcut menu at anytime by pressing and holding the Shortcut (S) button for 3 seconds.
Draft 4/14/15- Do Not Distribute Basic Operation and Navigation Shortcut (S) Button 3.2.1 Configure Shortcut (S) Button This feature allows you to change the function of the Shortcut (S) button. z To configure the Shortcut (S) button: 1. Press and release the Shortcut (S) button. 2. Select the Settings icon from the slide-out menu. 3. Choose the function you would like the Shortcut button to perform when pressed (Figure 3-2). The current/active setting is indicated by a yellow highlight box.
Draft 4/14/15- Do Not Distribute Basic Operation and Navigation LED Indicator 3.3 LED Indicator The power button is backlit by an light emitting diode (LED) (see Figure 2-1 on page 3 for location). The LED is used to indicate battery/power status and sleep mode activation.
Draft 4/14/15- Do Not Distribute Basic Operation and Navigation Basic Navigation Touch Screen Gestures This device uses common touch screen gesture motions (e.g. pinch-to-zoom, press and tap, pan and swipe). The terms used to describe the various gestures may vary (industry wide), however the general procedures and usage are similar for specific operations. Table 3-4 Common Gesture Names General Procedure Common Usage Tap Touch Select Quickly tap a point (once), then release.
Draft 4/14/15- Do Not Distribute Basic Operation and Navigation Basic Navigation 3.4.2 Starting the ShopStream Diagnostic Suite Program The ShopStream Diagnostic Suite program is the main program which is used for all diagnostic functions. The ShopStream Diagnostic Suite program is automatically started when the Diagnostic Tool is turned on through the Windows “start up” folder function. After the program has started, the ShopStream Diagnostic Suite Home Screen displays, see Home Screen Layout on page 17.
Draft 4/14/15- Do Not Distribute Basic Operation and Navigation Basic Navigation 3.4.4 Function Icons The Function Icons configure the Diagnostic Tool for the type of test to be performed. Table 3-5 on page 18 gives brief descriptions of the available icons, which operations are available depends upon the individual configuration of your system. Use the stylus or your finger tip to select from the icons.
Draft 4/14/15- Do Not Distribute Basic Operation and Navigation Basic Navigation Table 3-5 (table 2 of 2) Name Icon Description Help Opens the on-line help for the system. See Help Operations on page 139. System Settings Establishes and manages connections to peripheral devices, such as the Scan Module. See System Settings Operations on page 140. Exit Closes the Diagnostic Tool software and returns the display to the Windows desktop. See Turning Off on page 11. 3.4.
Draft 4/14/15- Do Not Distribute Basic Operation and Navigation Basic Navigation Menu Options The Menu icon on the Toolbar at the base of the display screen opens a list of basic operations and features. The list of options varies depending upon which module, or tool function, is active. Selecting a menu item opens a submenu of choices, and some submenus also open an additional menu. A right arrowhead () indicates additional choices are available. Touch an item to select it.
Draft 4/14/15- Do Not Distribute Basic Operation and Navigation Virtual Keyboard 3.4.6 Windows Taskbar The standard Windows taskbar displays program icons that are currently running or that you have pinned to the taskbar for quick access. Refer to Microsoft Windows 7 user documentation for additional information. Windows Taskbar Notification Area The notification area contains icons that provide active status and notifications of selected programs.
Draft 4/14/15- Do Not Distribute Basic Operation and Navigation Virtual Keyboard Figure 3-5 Virtual Keyboard notification area icon 1. Settings icon - opens the Virtual Keyboard settings window (Figure 3-7) 2. Expand icon - expands the Virtual Keyboard to full display (press again to return to standard display) 3. Top - moves the keyboard to top of screen 4. Close - closes the keyboard 5.
Draft 4/14/15- Do Not Distribute Basic Operation and Navigation Camera Operation 3.6 Camera Operation 3.6.1 Operating the Camera Selecting Camera from the shortcut (S) button menu opens the camera application. The touch screen becomes the view finder and is also used for reviewing photographs that are taken. Icons on the touch screen are used to operate the camera.
Draft 4/14/15- Do Not Distribute Basic Operation and Navigation z Wi-Fi Setup Taking pictures: 1. Press the Shortcut (S) Button and choose Camera from the menu. 2. Focus the image to be captured in the view finder. 3. Press the Photo icon. The view finder now shows the captured picture. 4. Select Save to save the image, or Delete to delete it. 5. Select Exit from the live view to close the camera application. 3.6.
Draft 4/14/15- Do Not Distribute Chapter 4 Scanner Function The Scanner function allows your Diagnostic Tool to communicate with the electronic control modules (ECMs ) of the vehicle being serviced. This allows you to perform tests, view diagnostic trouble codes (DTCs), and view live data parameters from various vehicle systems such as the engine, transmission, antilock brake system (ABS) and more. 4.
Draft 4/14/15- Do Not Distribute Scanner Function Basic Operation and Navigation 2. Select the Demonstration icon. A menu of demonstration choices now displays: – US Domestic—contains actual data captured while driving a 2001 Chevrolet Tahoe. Look for the throttle position (TP) sensor dropout while analyzing the data in Graphing mode. – OBD Training Mode—provides simulated data for an OBD-II/EOBD vehicle that allows you to access any of the standard functions. 3.
Draft 4/14/15- Do Not Distribute Scanner Function Basic Operation and Navigation 4.2.3 Scanner Screen Layout The Scanner screens typically include three sections (Figure 4-2): 1— Scanner Toolbar 2— Main Body 3— Lower Toolbar Figure 4-2 Scanner screen layout Scanner Toolbar The Scanner toolbar contains a number of icons that allow you to configure the displayed data and to exit.
Draft 4/14/15- Do Not Distribute Scanner Function Basic Operation and Navigation Table 4-1 Scanner toolbar icons (sheet 2 of 2) Name Icon Description Save Saves a copy of the current frame of data that can be viewed using Data Manager. Print Opens a standard Windows Print dialog box for saving a print copy of the current frame of data. More Opens a dropdown menu of the additional options shown below. Scale Switches the scale values, displayed along the left-hand side of the graphs, on and off.
Draft 4/14/15- Do Not Distribute Scanner Function Basic Operation and Navigation Figure 4-3 Sample custom configuration screen Keep the following in mind when configuring a custom data list: – – – – – – Gesture scroll if the list of parameters is longer than what is shown on the screen. Use the Select All icon to display the complete list. Use the Deselect All icon to remove all the currently selected parameters from the list. Select individual parameters to highlight and include them in the list.
Draft 4/14/15- Do Not Distribute Scanner Function Basic Operation and Navigation Alarm indicators now appear next to the selected parameters in the Data List (Figure 4-4). Figure 4-4 Sample alarm indicators i NOTE: Alarms can only be set for certain parameters. If the Alarm List dialog box is empty, no parameters are available and alarms cannot be set. Properties The Properties icon on the Scanner Toolbar is used to configure certain characteristics of the parameter graph display.
Draft 4/14/15- Do Not Distribute Scanner Function Basic Operation and Navigation Selecting either color option, Edit Plot Color or Edit Background Color opens a standard color selection dialog box. Select a color, then select OK to close the dialog box. The Show Grid icon is used to switch a background grid pattern on the data graphs on and off: • To switch the grid on; select to highlight Show Grid, then select Accept.
Draft 4/14/15- Do Not Distribute Scanner Function Basic Operation and Navigation Save The Save icon is used to record movies of vehicle datastream values. Saved files can be helpful when trying to isolate an intermittent problem or to verify a repair during a road test. z To save a movie: • Select Save. A save movie dialog box displays while data is being saved. The movie is saved when the message box disappears.
Draft 4/14/15- Do Not Distribute Scanner Function Basic Operation and Navigation If the Diagnostic Tool is connected to a printer, the current frame of data is printed. If the Diagnostic Tool is not connected to a printer, the frame of data is saved as an “XPS” file. A dialog box opens so that you can name the print file and specify the location that it is saved to, follow the on-screen instructions. Saved files can be printed at a later date, or opened and reviewed.
Draft 4/14/15- Do Not Distribute Scanner Function Basic Operation and Navigation Sweep The Sweep option switches the sweep values, displayed below the data graphs, on and off (Figure 4-10). The dropdown menu closes once a selection is made. Figure 4-10 Sample data graph sweep Main Body The main body of the screen varies depending on the stage of operation.
Draft 4/14/15- Do Not Distribute Scanner Function Basic Operation and Navigation Lower Toolbar Whenever communication is established with a vehicle, the Scanner continuously records data transmitted by the ECM in the data buffer. The toolbar below the main body of the screen contains the icons for navigating the buffered data and other options (Table 4-2).
Draft 4/14/15- Do Not Distribute Scanner Function Basic Operation and Navigation 4.2.4 Menu Options The Toolbar Menu icon at the base of the screen opens a menu near the top of the display. Figure 4-12 Sample Scanner Menu icon options The following Menu options are available: • • • • Safety Information—opens the Important Safety Instructions document. File—allows you to print or save the data being viewed. Tools—allows you to perform certain maintenance operations and adjust tool settings.
Draft 4/14/15- Do Not Distribute Scanner Function Basic Operation and Navigation Units Setup The units of measurement can be changed for temperature, vehicle speed, air pressure and other pressure readings. Choose between US customary or metric units of measure. z To change the units setup: 1. Select Tools > Units Setup. The Measurement Units Setup dialog box opens. Figure 4-13 Sample Units Setup screen 2. Use the dropdown menus to select the desired value for each item. 3.
Draft 4/14/15- Do Not Distribute Scanner Function Basic Operation and Navigation User’s Manuals This option opens a menu of additional support documentation, such as vehicle communication software manuals, available to assist in your diagnosis. These manuals provide connection information, detailed test procedures, and other resource material for specific vehicles. Figure 4-14 Sample User’s Manuals menu Select Exit to close the Help module and return to the Scanner.
Draft 4/14/15- Do Not Distribute Scanner Function Scanner Operation 4.3 Scanner Operation The Scanner function has two main operation features: • Scanner—allows communication with the vehicle ECMs to review DTCs, view parameter data, and perform functional tests. • Fast-Track Troubleshooter—provides access to troubleshooting information from a database of experienced based information developed by master technicians. z Basic Scanner Operation Steps 1. Open Scanner—Select Scanner on the Home screen. 2.
Draft 4/14/15- Do Not Distribute Scanner Function Scanner Operation 2. Select the manufacturer of the test vehicle from the list. A model year menu displays. i NOTE: You can limit the number of manufacturers that appear on the list by selecting Configure Favorites from the toolbar. See Creating a Favorites List on page 76 for details. 3. Select the year of the test vehicle from the menu. A list of vehicle types or models displays.
Draft 4/14/15- Do Not Distribute Scanner Function Scanner Operation 4.3.3 Vehicle System and Test Selection z Selecting a vehicle system: 1. After the vehicle has been identified, a list of available systems for testing displays (Figure 4-17). Select a system to continue. Figure 4-17 Systems menu 2. After a system is selected and the Scanner establishes communication with the vehicle, the Scanner Main menu displays available tests. Select a menu item to continue.
Draft 4/14/15- Do Not Distribute Scanner Function Scanner Operation Main menu options vary slightly by year, make, and model. The main menu may include: • Data Display— displays data parameter information from the vehicle electronic control module (ECM). Selecting may open a submenu of viewing options. • Codes Menu—displays diagnostic trouble code (DTC) records from the vehicle electronic control module. Selecting may open a submenu of viewing options.
Draft 4/14/15- Do Not Distribute Scanner Function Scanner Operation Figure 4-19 Sample code list and SureTrack information Clear Codes The Scanner clears trouble codes from the ECM memory on some vehicles. If this function is not available on the test vehicle, Clear Codes does not appear as a menu option. z To clear codes: 1. Select Clear Codes from the Codes Menu. A confirmation message displays. 2. Make sure any conditions shown on the confirmation message are met, then select Yes.
Draft 4/14/15- Do Not Distribute Scanner Function Scanner Operation 4. Select the virtual keyboard Return key once all the code characters are entered. Figure 4-20 Sample DTC Status entry field The DTC status report displays (Figure 4-21). Figure 4-21 Sample DTC status report 5. Select Exit to return to the DTC status entry screen. 6. Select Exit again to return to the Codes menu.
Draft 4/14/15- Do Not Distribute Scanner Function Scanner Operation Data Display Depending upon the test vehicle, this selection may appear as Data, Data Display, Data Only, Data (No Codes), or something similar. All are similar. Selecting has one of the following results: • A submenu of data viewing choices displays. • Vehicle data displays. A submenu displays when more than one data viewing mode is available on the identified vehicle.
Draft 4/14/15- Do Not Distribute Scanner Function Scanner Operation Data Graphs Select the Graph icon to open a data graph for that parameter (Figure 4-23). Selecting a parameter for graph view moves it to the top of the list. Select the Graph icon again to close the graph for that parameter and return to a data list view.
Draft 4/14/15- Do Not Distribute Scanner Function z Scanner Operation To adjust the amount of data collected after a trigger: 1. Select the Properties icon on the Scanner toolbar to open the dialog box. 2. Highlight one of the Samples After Trigger options: 3. Select the Accept icon to close the dialog box. i NOTE: You can also adjust the amount of data collected after a triggering event using the Properties icon on the Scanner toolbar. See Properties on page 30 for additional information.
Draft 4/14/15- Do Not Distribute Scanner Function Scanner Operation Once all of the data is compiled, data collection pauses and the information is saved as a movie. A confirmation screen displays to let you know the name automatically assigned to the saved file and where to locate it. Figure 4-26 Sample saved movie confirmation screen 8. Select OK to close the confirmation screen. 9. Select the Play icon on the toolbar to resume viewing live data. i NOTE: Selecting an armed Snapshot icon disarms it.
Draft 4/14/15- Do Not Distribute Scanner Function Scanner Operation Figure 4-27 Sample manual scale selection The dialog box closes and the parameter scale is now at the set values. Using Zoom The zoom options on the Data Buffer toolbar allow you to change the magnification level of the sweep when viewing data graphs. Use the Zoom In (+) icon to increase magnification, and the Zoom Out (–) icon to decrease magnification.
Draft 4/14/15- Do Not Distribute Scanner Function Scanner Operation Some toggle and variable control tests display functional test controls at the top of the screen with data stream information below (Figure 4-28). Figure 4-28 Sample functional test controls Functional test controls allow you manipulate the test signal as shown in Table 4-4. Table 4-4 Functional test control icons Name Icon Description Test Activates the test. Return Moves focus back to the data list.
Draft 4/14/15- Do Not Distribute Scanner Function Scanner Operation Generic Functions The Generic Functions selection opens a menu of available OBD-II/EOBD functions on 1996 and newer vehicles. For additional information on generic functions refer to the Global OBD Vehicle Communications Software Manual.
Draft 4/14/15- Do Not Distribute Scanner Function Stopping Communication and Exiting the Scanner Certain live data parameter values display directly within the tip when performing Troubleshooter tests and procedures. A tip may also contain a hyperlink to a Troubleshooter Reference, another test or procedure, or a supplemental operation, such as Clear Codes. Hyperlinks are shown in blue, and selecting them opens the link. Troubleshooter References open in a separate window. (Figure 4-29).
Draft 4/14/15- Do Not Distribute Scanner Function z Stopping Communication and Exiting the Scanner To exit Scanner and disconnect from a vehicle: When disconnecting the Diagnostic Tool from the vehicle, make sure the Scanner software is not communicating with the vehicle. 1. From a codes or data display screen, select the Exit icon on the upper toolbar. Figure 4-30 Exit icon The screen goes to the codes or data menu. 2. Select the Back icon on the upper toolbar.
Draft 4/14/15- Do Not Distribute Chapter 5 Scan Module Operation This chapter describes the connection, operation, troubleshooting and updating of the Scan Module. 5.1 Overview The Scan Module is a wireless device that is connected to the vehicle and transmits vehicle data to the Diagnostic Tool. The Scan Module operates on 12 or 24VDC vehicle power, supplied through the vehicle’s data link connector (DLC).
Draft 4/14/15- Do Not Distribute Scan Module Operation Pairing The Scan Module 5.2 Pairing The Scan Module To use the Scan Module with the Scanner or OBD-II/EOBD functions, it must first be paired with the Diagnostic Tool. Pairing is the wireless connection (identification) process used to connect the Scan Module to your Diagnostic Tool. The Scan Module only needs to be paired once before it’s initial use.
Draft 4/14/15- Do Not Distribute Scan Module Operation Checking Scan Module Paired Status A search in progress message displays during the pairing procedure (Figure 5-3), the Paired Devices screen (Figure 5-4) displays once the procedure completes. Figure 5-3 Sample pairing in progress message 7. Select the Home icon on the Toolbar. 8. Disconnect the data cable from the vehicle.
Draft 4/14/15- Do Not Distribute Scan Module Operation Data Cable Connection 5.4 Data Cable Connection To use the Scan Module for Scanner and OBD-II/EOBD testing, it must first be connected to the vehicle’s data link connector (DLC). Depending on the vehicle, the supplied DA-4 data cable may be used alone or may require optional adapters. • All OBD-II/EOBD compliant vehicles - Use the supplied DA-4 data cable. The 26-pin end of the cable attaches to the data cable connector on the Scan Module.
Draft 4/14/15- Do Not Distribute Scan Module Operation Troubleshooting 5.5 Troubleshooting The Scan Module is a wireless communications device that uses Bluetooth technology to transmit vehicle data to the Diagnostic Tool without a physical connection. The working range of the transmitter is about 30 feet (9.14 m). Scan Module operations can be impacted when signal interference, or some other condition, disrupts or impairs the wireless communication network.
Draft 4/14/15- Do Not Distribute Scan Module Operation Troubleshooting The Hardware Status indicators in the lower-right corner of the Home screen provide a quick reference to wireless operations. The background color of the status indicator icon represents the condition of the wireless connectivity to that device. Icon status is shown in the table below: Hardware Icon Background Color Red Grey Blue Condition Action Not Paired Pair the Scan Module to the Diagnostic Tool.
Draft 4/14/15- Do Not Distribute Scan Module Operation Troubleshooting Each LED can be in one of three states; off, lit solid, or flashing. Interpret as follows: • Vehicle Power – Off, vehicle power is not being supplied to the Scan Module through the data cable – On Solid, the Scan Module is being powered by the vehicle, but not communicating with the Diagnostic Tool. – Flashing, the Scan Module is being powered by the vehicle and is communicating with the Diagnostic Tool.
Draft 4/14/15- Do Not Distribute Scan Module Operation i Troubleshooting NOTE: The ShopStream Diagnostic Suite can also be started from the Windows Start menu. Alternate Recovery Procedures Use these methods as an option to the Recovery Procedure, or when recovery fails to restore the wireless connection. USB Procedure This method establishes a “hard-wired” USB cable connection between the modules. z To create a USB connection: 1.
Draft 4/14/15- Do Not Distribute Scan Module Operation Updating Scan Module Firmware Windows Reboot Procedure This method, which completely shuts down the Diagnostic Tool, takes several minutes to complete. z To reboot the Diagnostic Tool: 1. Disconnect the Scan Module from the vehicle. 2. Navigate to the Home Screen on the Diagnostic Tool. 3. Select Exit to close the ShopStream Diagnostic Suite. 4. Select Start in the lower-left corner of the screen to open the menu. 5.
Draft 4/14/15- Do Not Distribute Scan Module Operation z Updating Scan Module Firmware Updating Scan Module firmware: IMPORTANT: The Diagnostic Tool must be connected and powered by the AC/DC power supply during the Scan Module firmware update process. Damage can occur to the Scan Module if the Diagnostic Tool power is turned off or the power supply is disconnected during the firmware update process. 1. Connect the AC/DC power supply to the Diagnostic Tool. 2. Turn on the Diagnostic Tool. 3.
Draft 4/14/15- Do Not Distribute Scan Module Operation Updating Scan Module Firmware The update begins and installation progress is tracked on the screen (Figure 5-11). Figure 5-11 Sample update in progress screen A “successfully updated” message displays once the installation process is complete (Figure 5-12). Figure 5-12 Sample firmware update complete message 6. Select OK to close the message and return to Scanner operations. The Scan Module, now has the latest firmware update, is ready to use.
Draft 4/14/15- Do Not Distribute Chapter 6 OBD Direct Operations This Home screen option allows you to access Generic OBD-II/EOBD Scanner tests without completing a vehicle identification. OBD Direct presents a quick way to check for diagnostic trouble codes (DTCs), isolate the cause of an illuminated malfunction indicator lamp (MIL), check monitor status prior to emissions certification testing, verify repairs, and perform a number of other services that are emissions-related.
Draft 4/14/15- Do Not Distribute OBD Direct Operations OBD Health Check 6.1 OBD Health Check The OBD Health Check offers a way to quickly check for and clear generic diagnostic trouble codes (DTCs) and to check readiness monitors. Selecting OBD Health Check opens a submenu of options (Figure 6-2). Figure 6-2 Sample OBD Health Check menu 6.1.1 Global OBD II Code Check This option displays any stored emission related generic DTCs reported by the ECM.
Draft 4/14/15- Do Not Distribute OBD Direct Operations OBD Health Check Pending Codes The purpose of this service is to enable the scan tool to obtain “pending” or maturing diagnostic trouble codes. These are codes whose setting conditions were met during the last drive cycle, but need to be met on two or more consecutive drive cycles before the DTC actually sets.
Draft 4/14/15- Do Not Distribute OBD Direct Operations OBD Diagnose 6.1.4 MIL Status This item is used to check the current condition of the malfunction indicator lamp (MIL). Additional information, such as which ECM commanded the MIL on and the distance driven while the MIL is on (if supported), can also be displayed. It is also possible to print the MIL Status. 6.
Draft 4/14/15- Do Not Distribute OBD Direct Operations OBD Diagnose 2. Select Continue. A communications message that shows how many ECMs were detected, which ECM is communicating, and which communication protocol is being used displays (Figure 6-5). Figure 6-5 Sample communication message 3. Select Continue and a menu of available tests displays (Figure 6-6). Figure 6-6 Sample Start Communication menu 4. Select a test to continue.
Draft 4/14/15- Do Not Distribute OBD Direct Operations OBD Diagnose Readiness Monitors Use this menu item to check the status of the monitored system. If a monitored system is not supported, it is not displayed. Scroll, if needed, to view the entire list of monitors. Selecting Readiness Monitors opens a submenu with two choices: • Monitors Complete Since DTC Cleared—displays the results of all monitor tests that have run since the last time the electronic control module (ECM) memory was cleared.
Draft 4/14/15- Do Not Distribute OBD Direct Operations OBD Diagnose ($04) Clear Emissions Related Data This item is used to clear all emission related diagnostic data such as, DTCs, freeze frame data, and test results from the memory of the selected ECM. ($05, 06, 07) Display Test param./Results This option opens a submenu of test parameters and test results from various sensors, monitor test results, and a record of DTCs detected during the last drive cycle.
Draft 4/14/15- Do Not Distribute OBD Direct Operations OBD Diagnose 6.2.2 Connector Information This option opens a database of vehicle diagnostic connector locations that includes most makes and models. z To locate a vehicle diagnostic connector: 1. Select Connector Information from the System menu. 2. Select a manufacturer from the list presented. 3. Select a model from the list presented. Instructions for which, if any, cable adapter or pin to use displays. 4. Select Continue.
Draft 4/14/15- Do Not Distribute Chapter 7 Guided Component Test Operations The Guided Component Test software is a component-testing powerhouse, providing you with a robust diagnostic database for use with scopes and meters. It is like having access to a complete library of shop manuals for testing engine-management components, transmission sensors and components, and ABS systems.
Draft 4/14/15- Do Not Distribute Guided Component Test Operations Vehicle Identification 7.1.1 Menu Options, Guided Component Test Selecting the Toolbar Menu icon at the base of the screen offers the following options: • Safety Information—opens the Important Safety Instructions document. See Safety Information on page iii for additional information. • File—allows you to print, save and set page settings of the data being viewed.
Draft 4/14/15- Do Not Distribute Guided Component Test Operations Vehicle Identification How To The How To option provides a list of available on-screen instructions for performing tasks. Scroll to view the entire list. Typical topics include: • 10-Minute Electronic Classes—provides brief instruction in basic electronics and circuit connections. • 15-Minute Ignition Classes—provides an introduction to basic ignition testing.
Draft 4/14/15- Do Not Distribute Guided Component Test Operations Vehicle Identification 7.1.2 Creating a Favorites List Once a Guided Component Test database is loaded, a list of manufacturers displays. This list is often long and includes makes that are not frequently used. A toolbar at the top of the screen allows you to custom configure the manufacturer list to display only the makes you frequently service. Figure 7-1 Sample manufacturer list z To configure a favorites list: 1.
Draft 4/14/15- Do Not Distribute Guided Component Test Operations i Vehicle Identification NOTE: Manufacturers appear on the favorites list in the order in which they are selected. Therefore, if you select the makes you work on most frequently first, they will appear at the top of the list. 3. Select Finished on the toolbar once your selections have been made. The screen returns to the manufacturer list, but only the makes you selected display.
Draft 4/14/15- Do Not Distribute Guided Component Test Operations Vehicle Identification A list of tests available for the identified vehicle displays (Figure 7-4). Figure 7-4 Sample available tests list 8. Select FUEL INJECTION and a fuel injection component test menu displays (Figure 7-5). Figure 7-5 Sample available component tests list 9. Select a test to continue.
Draft 4/14/15- Do Not Distribute Guided Component Test Operations Operations 7.2 Operations The Guided Component Test software provides vehicle specific Guided Component Test procedures and information that aid in setting up scopes and meters. Once a test vehicle is identified, you can select a Guided Component Test from the list of available tests. For most selections two main choices are available on the component menu: 1.
Draft 4/14/15- Do Not Distribute Guided Component Test Operations i Operations NOTE: An additional selection, such as front or rear for an oxygen sensor (O2S), may be required before advancing to the component information screen. The component information screen displays (Figure 7-6). 3. Always Gesture sweep to view any additional information below what is visible. 4. Select Back at any time to return to the previous screen. 7.2.
Draft 4/14/15- Do Not Distribute Guided Component Test Operations Operations 3. Select a test option and the test screen displays (Figure 7-8). Figure 7-8 Sample Test screen 4. Gesture sweep to view any additional information. 5. Select Back at any time to return to the previous screen, or select Exit to return to the main component menu.
Draft 4/14/15- Do Not Distribute Guided Component Test Operations Operations View Meter A Meter icon, which is only available in the Guided Component Test view meter mode, appears on the upper toolbar (Figure 7-9). Figure 7-9 Sample view meter window Three view meter options are available: 1. With View Meter active (Figure 7-9), select the Meter icon on the toolbar once and the meter expands to fill the entire screen. 2.
Draft 4/14/15- Do Not Distribute Guided Component Test Operations Operations Selecting the Close icon (red box with an X) when viewing the meter in a separate window closes the meter and returns you to the Guided Component Test screen. 3. Select the Meter icon a third time to close the separate window and return to the standard meter view as shown in Figure 7-9. Select Exit from the toolbar to close meter view and return to the Guided Component Test screen.
Draft 4/14/15- Do Not Distribute Chapter 8 Scope and Multimeter Operations The Scope Multimeter function provides all the tools needed for performing electrical and electronic circuit tests and for monitoring signals and circuit activity. The Scope Module easily separates from the Diagnostic Tool and connects with a USB cable so that test results can be remotely monitored as you perform other tasks. The Scope Multimeter function works interactively with other functions.
Draft 4/14/15- Do Not Distribute Scope and Multimeter Operations i Using the Scope Module Remotely NOTE: If the Scope Module: ○ Is undocked from the Diagnostic Tool when it is on, or ○ Is exposed to a electro static discharge (ESD) while it is being used remotely the following will occur: • Communication between the Diagnostic Tool and the Scope Module will be terminated. • All current data and settings will be lost. • An error message (e.g.
Draft 4/14/15- Do Not Distribute Scope and Multimeter Operations Getting Started 8.2 Getting Started The Scope and Multimeter module enables the following functions: • • • • Lab Scope Ignition Scope Graphing Multimeter Digital Multimeter 8.2.1 Capabilities The following tables detail the software and hardware capabilities. Table 8-1 Scope Function Range Ch. 1—yellow banana jack Ch. 2—green banana jack Signal Measurement Ch. 3—blue banana jack Ch.
Draft 4/14/15- Do Not Distribute Scope and Multimeter Operations Getting Started Table 8-2 Graphing Multimeter (part 2 of 2) Function Ohms Range 40 Ohm–4 MOhm Low Amp Probe 20A scale (100mV/Amp) 40A scale (10mV/Amp) 60A scale (10mV/Amp) Accuracy/Comments Fixed scales Connect Low amp Probe (+) to Ch. 1 (yellow banana jack) and (–) to GND input (black banana jack). See NOTE below.
Draft 4/14/15- Do Not Distribute Scope and Multimeter Operations Getting Started Channel 1 Lead Figure 8-3 Yellow Channel 1 Lead The shielded yellow lead is used for Channel 1 (Figure 8-3) and other channel connections that need additional grounding. The lead color matches the color of socket 1 on the Scope Module and the color of trace 1 on the test screens. This yellow lead includes a black, right-angle, common ground plug and a black, stackable, common ground plug.
Draft 4/14/15- Do Not Distribute Scope and Multimeter Operations Getting Started Alligator Clips Figure 8-7 Alligator clip Insulated alligator clips, colored to match each test lead, are included. A black clip for the common ground lead is also supplied (Figure 8-7). Each clip plugs into the straight end of a channel lead. Test Probes Figure 8-8 Test probe Two test probes are included, one black and one red (Figure 8-8). The test probes plug into the straight end of the test leads.
Draft 4/14/15- Do Not Distribute Scope and Multimeter Operations Getting Started Inductive RPM Pickup Adapter (optional) Figure 8-11 Inductive RPM Pickup adapter The optional Inductive RPM Pickup adapter (Figure 8-11) connects to the scope auxiliary connector of the Diagnostic Tool with a DB9F plug. It can be used to trigger a waveform or display RPM. With the Ignition Scope, the RPM Pickup connects to cylinder number one to establish the firing order.
Draft 4/14/15- Do Not Distribute Scope and Multimeter Operations Navigation Setup This option allows you to adjust tool settings to your personal preferences. Selecting opens a menu of the following: • Unit Setup—opens the Unit Setup dialog box to adjust trace and display settings • Snapshot—opens the Snapshot dialog box for selecting how triggered data is saved. • Ignition—opens the Ignition dialog box for setting up to display secondary ignition patterns.
Draft 4/14/15- Do Not Distribute Scope and Multimeter Operations Navigation 1— Scope Multimeter Toolbar 2— Main body 3— Trace Details 4— Record/Playback Control Toolbar Figure 8-13 Scope Multimeter screen layout 92
Draft 4/14/15- Do Not Distribute Scope and Multimeter Operations Navigation Scope Multimeter Toolbar The Scope Multimeter toolbar is used to set up the tool for testing and to configure the settings for each trace. Table 8-4 on page 93 gives brief descriptions of the control icons on the toolbar: Table 8-4 Scope Multimeter toolbar icons Name Icon Description Back Returns to the previously viewed screen.
Draft 4/14/15- Do Not Distribute Scope and Multimeter Operations Navigation Trace Details The Trace Details section displayed at the base of the screen can be used to quickly adjust settings for capturing the trace. The Trace details are accessed using either the Data icon on the upper toolbar or the Touch and Grow icon on the Playback toolbar. Both icons function the same and cycle the Trace Details selection through three states: • Displayed—trace settings are displayed in this mode.
Draft 4/14/15- Do Not Distribute Scope and Multimeter Operations Navigation The following trace adjustments and settings are available: • Profile—switches the trace for the selected channel on and off. • Channel—opens a dialog box that allows you to configure the trace setup (see Trace Controls on page 99 for details). • Probe—opens a dialog box that allows you to select the type of test probe being used.
Draft 4/14/15- Do Not Distribute Scope and Multimeter Operations Navigation Table 8-5 Data buffer toolbar icons (part 2 of 2) Name Icon Description Stop Stops recording data Record Begins recording data Play Recording Plays the data recording in a continuous loop at actual speed Forward 1 Frame Moves to the next frame in the recorded data Step Forward Moves to the next point in the recorded data Position Indicator In record mode, indicates how much data is collected.