
Body Balance Comfort Operating Instructions


27
GB
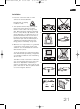
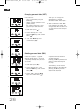
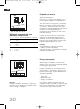
UnitMaximum
value
Minimum value
Body water
Body fat
Muscle proportion
Status indicator
Trend display
Day - Week - Month
Trend curve
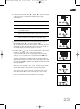
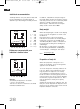
Please weigh yourself regularly so
that the trend curve will be
display a precise trend.
The trend curve can display up
to 59 values, subject to a corre-
sponding number of measure-
ments.
In case of several measurements
daily, one single median value is
stored.The weekly median value
is determined based on 7 daily
values.
The monthly median value is
determined based on 30 daily
values.
The value displayed after "max”
and "min” is the maximum or
minimum value of the curve –
rounded up or down to the next
whole number.
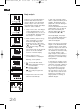
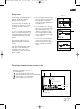
1. The calculated average range
for the respective person will
be displayed in the trend
curve in the area between the
boundary lines.
2. If a boundary line of the ave-
rage value is positioned outsi-
de of the display range – in
relation to the trend curve –
the corresponding boundary
line is displayed on the edge
of the screen.
3. If only one line is displayed
on the top or bottom, this
means that the total curve is
above or below the average
range.
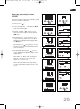
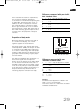
* Meaning of symbols for action
recommendations:
+
You should drink more fluids!
+
Muscle growth training is recommended!
+ Diet change is recommended!
Your analysis values are ok!
The display symbols of your analysis scale
Border line
1.
2.
3.
Normal
range
Recommendations
*
BA63687CF5121434_GB 03.10.2007 16:55 Uhr Seite 27