
Owner's manual
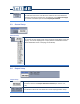

19
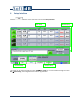
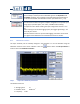
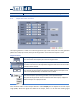
7.4 Display Area
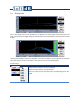
One or two graph areas can be displayed in the Display Area. Each graph contains two plots. The
graph settings can be changed during the measurement. Data is displayed in real-time with a refresh
of 1/3 s.
If two plots with different units are displayed, a second Y axis appears on the right side of the graph.
Then, each plot has its own Y axis which is the same color as its corresponding plot.
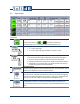
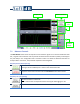
Graph settings
Display Input
These controls select the inputs to be display.
Below the input selection is its global level.
The color of the control is the same as the corresponding plot on the
graph.