
Owner's manual

20
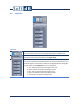
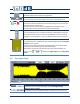
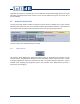
Display Units
This control sets the units for the graph and for the global levels.
• dB: decibels.
• dBA or dB(A): decibels after A frequency weighting is
applied.
• rms : root mean square in Unit rms.
• Peak: maximum level.
• rms
2
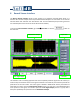
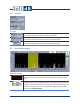
Display Graph Type
This control applies to both plots of the graph. The type can be time
signal, global historic or one of the FFT spectrum
3
.
• Time Signal: frames of 1/3 s of time signal.
• Historic: History of global levels vs time.
• Instant Spectrum: FFT Spectrum on time signal frames.
• Fast exponential Spectrum: average filter with τ = 1/8 s.
• Slow exponential Spectrum: average filter with τ = 1 s.
• Average Spectrum: linear average.
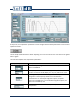
Reset Average
This button resets the averaging of signal (exponential spectrums
and average spectrum) and also resets the historic graph.
Frequency lin/log
This control sets the X axis of the spectrum graph in linear or
logarithmic scale.
Y rescale
This button adjusts the Y scale to the graph data. If two Y scales are
present on the same graph, both axes are rescaled independently.
and
Magnifier buttons
See section 8.4.1 below for details.
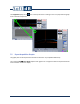
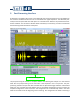
7.4.1 Magnifier
Each graph has a icon at the top left corner. Clicking on this icon pops-up the graph on a
magnified display.
3
In the particular case where the Frequency Bandwidth is 24 kHz and 4 inputs are enabled, the bottom graph
of the Acquisition Interface will not allow spectrum graph types or dBA units.