
Owner's manual

22
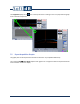
8 Record Viewer Interface
The Record Viewer Interface allows a basic analysis of a previously recorded wave signal on a
Concerto Unit. Further analysis of the acquired data should take place on a PC. When run on a PC the
“Record Viewer tab” becomes the “Post-Process tab” and the advanced post-processing functions
are unlocked (refer to the section 10 of this document for details).
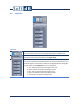
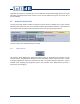
To access the Record Viewer Interface, go to File
Open Data or click the button on
the menu bar.
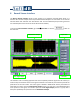
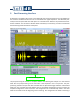
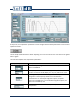
This interface uses a streaming approach that never completely loads the signal into the memory. In
order to keep the overview of the entire signal contained in the wave file, the interface presents the
peak values of the entire wave. The entire signal is divided in 4096 blocks and the peak values of
each block are used to form the Peak Historic Graph (section 9.3, p.24). For a more detailed view of
some portions of the signal, the interface presents a Time Signal Graph (section 9.4, p.25) with a
time span specified by the yellow area on the Peak Historic Graph.
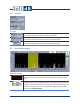
Peak Historic Graph
Time Signal Graph
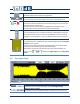
File Info
Input Info