
Owner manual

8
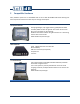
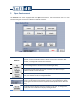
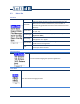
4.4 File Info
File Info
This area displays relevant
information about the
current file.
It also contains controls
allowing to go to the
previous or next file in the
current directory
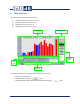
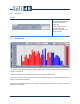
4.5 Display Area
The display area shows the spectrum and the global level in real-time during a measurement or of a
file when it is loaded.
The tabs at the left allow to switch between Intensity, Pressure and PI Index.
The refresh arrows at the top-left corner allow rescaling the graph axis to the data contained in the
spectrum and the global level bar.
Note: When displaying intensity, the red color represents positive intensity and blue represents
negative intensity vector.